

Use the GEE to identify areas that are flooded in the wet season.
The Google Earth Engine (GEE) contains the complete Landsat archive. This collection can be used to identify areas that are inundated in the wet season, but not inundated in the dry season. Follow the steps below to setup the script.
1. Copy the GEE template into a new script and fill in the author details, date and contact information.
2. Import the Landsat 5, 6 and 7 collections.
3. Define the time range from 2006 – 2016.
// Define time range
var startyear = 2006;
var endyear = 2016;

// Set date in ee date format
var startdate = ee.Date.fromYMD(startyear,1,1);
var enddate = ee.Date.fromYMD(endyear,12,31)
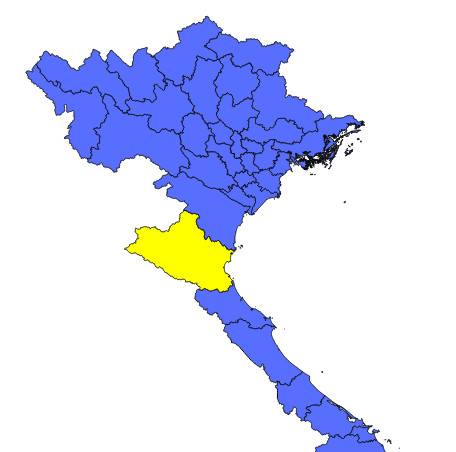
4. Download the shapefile with the administrative boundaries of Vietnam here.
5. Open the file Qgis, select Nghe An and save the selection as a KML file.
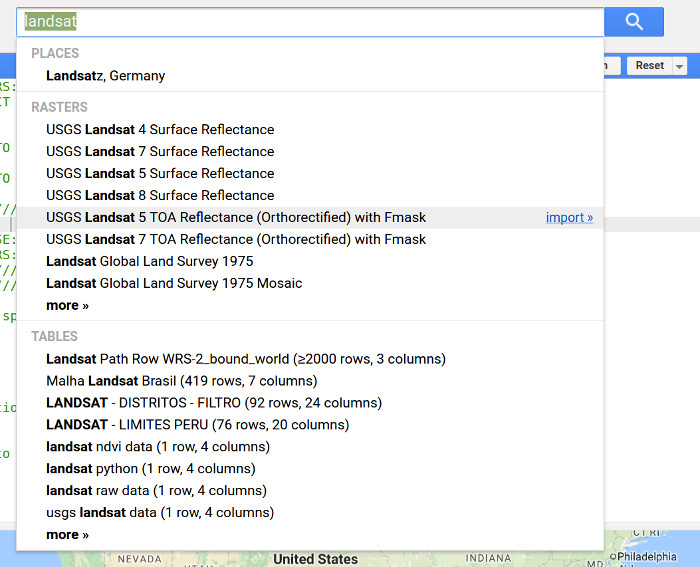
6. Upload the shapefile of Nghe an as a fusion table here
7. Click file -> about this table -> copy the the id of the table

8. Import the fusion table. Use your id at ‘ft:yourid’
// province
var NgheAn = ee.FeatureCollection('ft:yourid','geometry');
9. Display the province boundaries.
// add layers
Map.centerObject(NgheAn, 8);
Map.addLayer(NgheAn)
10. Filter the imagecollection on dates and location
// filter on date and bounds
var l5images = l5.filterDate(startdate,enddate).filterBounds( NgheAn);
var l7images = l7.filterDate(startdate,enddate).filterBounds( NgheAn);
var l8images = l8.filterDate(startdate,enddate).filterBounds( NgheAn);
11. Include the could function and filter the clouds from the image collection.
// set cloud threshold
var cloud_thresh = 40;

var cloudfunction = function(image){
  //use add the cloud likelihood band to the image
  var CloudScore = ee.Algorithms.Landsat.simpleCloudScore(image);
  //isolate the cloud likelihood band
  var quality = CloudScore.select('cloud');
  //get pixels above the threshold
  var cloud01 = quality.gt(cloud_thresh);
  //create a mask from high likelihood pixels
  var cloudmask = image.mask().and(cloud01.not());
  //mask those pixels from the image
  return image.updateMask(cloudmask);
};
12. Run the cloud removal function for all image collections.
// mask all clouds in the image collection
l5images = l5images.map(cloudfunction);
l7images = l7images.map(cloudfunction);
l8images = l8images.map(cloudfunction);
13. Select the Green and NIR bands.
// Select the green and NIR bands
l5images = l5images.select(["??","??"]);
l7images = l7images.select(["??","??"]);
l8images = l8images.select(["??","??"]);
14. Include functions to calculate the NDWI.
// calculate ndwi from landsat 8
function l8Ndwi(img) {
  var ndwi = img.normalizedDifference(['??', '??']).rename('NDWI');
  return img.addBands(ndwi);
}

// calculate ndwi from landsat 5 & 7
function l57Ndwi(img) {
  var ndwi = img.normalizedDifference(['??', '??']).rename('NDWI');
  return img.addBands(ndwi);
}
15. Apply the NDWI function to all images in the image collection
// calculate ndwi for each image in imagecollection
var l5ndwi = l5images.map(l57Ndwi);
var l7ndwi = l7images.map(l57Ndwi);
var l8ndwi = l8images.map(l8Ndwi);
16. Merge the three image collections into one single image collection.
// combine all data in single image collection
var allcollection =  ee.ImageCollection((l5ndwi.merge(l7ndwi)).merge(l8ndwi));
17. Select the dry and wet pixels from the image collection using the ee.Reducer.percentile function. Select the 20 and 80 percentile.
// select dry and wet conditions
var dry = allcollection.select("NDWI").reduce(ee.Reducer.percentile([??]))
var wet = allcollection.select("NDWI").reduce(ee.Reducer.percentile([??]));
18. Add a visualization palette to the script
// create visualization settings of NDWI
var ndwi_viz = {min:-1.0, max:1.0, palette:"a3a3a3,e9ff34,53db46,6699CC"};
19. Add the dry and wet maps as a layer.
// add layers
Map.addLayer(dry.clip(NgheAn),ndwi_viz,"dry");
Map.addLayer(wet.clip(NgheAn),ndwi_viz, "wet");
20. Create a difference map between the wet and dry season by means of subtraction.
// difference map
var diff = wet.subtract(dry)
21. Add the difference map as a layer
// add map
Map.addLayer(diff.clip(NgheAn),ndwi_viz, "Wet - Dry");
22. Use the greater than statement to identify areas flooded in the wet, but dry in the wet season. Experiment with different thresholds.
var mydiff = diff.gt(0.3)
// add map
Map.addLayer(mydiff.updateMask(mydiff).clip(NgheAn),{palette:"0000FF"},'flooded areas - blue');
Find the complete script here

Thanks for the post. What’s going on step 22, Do these areas are identified as flooded regions?
LikeLike
mula
LikeLike