

Processing high resolution satellite precipitation data.
Climate Hazards Group InfraRed Precipitation with Station data (CHIRPS) is a 30+ year quasi-global rainfall dataset. Spanning 50°S-50°N (and all longitudes), starting in 1981 to near-present, CHIRPS incorporates 0.05° resolution satellite imagery with in-situ station data to create gridded rainfall time series for trend analysis and seasonal drought monitoring.
Background information (abstract) on the CHIRPS data which be found here.
step 1: Go to this website and look around for data products.
step 2. Go to the ftp site.
Step 3. Download the monthly data product for the year 2000 in Geotiff format.
TIP: you can also open the ftp site in your file explorer.
step 4. Extract the products.
TIP: install an application like 7-zip if you are not able to extract the files.
step 5. Open the products in QGIS.
step 6. Download the world shapefile:
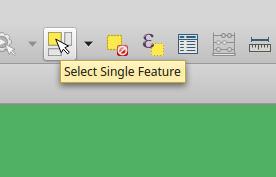
step 7. Select Vietnam using the “select Single Feature” button in QGIS.
step 8. right click “TM_WORLD_BORDERS-0.3.shp” and select “Save Selection as” and save the new map as ESRI shapefile with the name Vietnam.
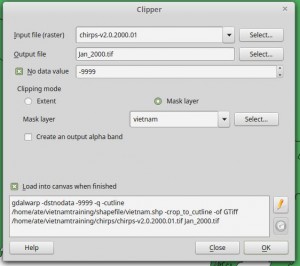
step 9. Clip Vietnam from all CHIRPS files using Raster → Extraction → Clipper:
Question 3.4: make a screenshot of the result (December) and include it in the report.
step 10: right click the maps, go to properties and metadata. Use the statistics data to calculate precipitation for each month.

Nice web blog. Excellent for people needing a fast and steep learning curve in RS-data handling and QGIS.
LikeLike