
Who said landuse classification is difficult?
In the next exercise we will use the Google Earth Engine to create a landuse map using landsat-8. This time we use the spectral signature, whereas we used the temporal signature in the previous exercise.
Step 1: Import the landsat-8 imagecollection.
Step 2: define the time range of interest:
// define start of time series
var startdate = ee.Date.fromYMD(2013,1,1);
// define end of time series
var enddate = ee.Date.fromYMD(2016,12,1);
Step 3: Import a fusion table with your area of interest.
// the ca basin
var CaBasin = ee.FeatureCollection('ft:1ILFPzWUf4dL_tKNY0Rd3EhGtRQoLfzmk_00i9xC3');
Step 4: filter the image collection based on date and location.
// filter on date and location
var l8images = l8.filterDate(startdate,enddate).filterBounds(CaBasin);
Step 5: apply the cloud function to filter the clouds:
// set cloud threshold
var cloud_thresh = 40;

// the cloud function
var cloudfunction = function(image) {
  //use add the cloud likelihood band to the image
  var CloudScore = ee.Algorithms.Landsat.simpleCloudScore(image);
  //isolate the cloud likelihood band
  var quality = CloudScore.select('cloud');
  //get pixels above the threshold
  var cloud01 = quality.gt(cloud_thresh);
  //create a mask from high likelihood pixels
  var cloudmask = image.mask().and(cloud01.not());
  //mask those pixels from the image
  return image.updateMask(cloudmask);
};

// filter clouds for all images in imagecollection
l8images = l8images.map(cloudfunction);
Step 6: Add a map with the visual bands to the map for visual inspection
var ls8_viz = {bands:["B4","B3","B2"], min:0.0, max:0.3};
Map.addLayer(l8images.median().clip(CaBasin), ls8_viz, "ls8_nocloud");
Step 7: Create a list with landsat-8 bands
// list with l8 bands
var LS8_bands = ['B2', 'B3', 'B4', 'B5', 'B6', 'B7'];//, 'B10', 'B11'];
Step 8: Create a training image with the median of the 8 landsat bands.
// make the training image
var TrainingImage = ee.Image(1)
      .addBands(l8images.median().select(LS8_bands).float())
      .clip(CaBasin);
Step 9: Set the selection bands.
// set the selection bands
var predictionBands = TrainingImage.bandNames();
we need to create training areas to tell the earth engine what type of landuse classes we have in the different areas.
Step 10: Select draw a shape.
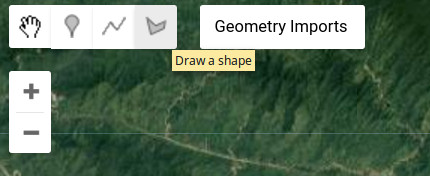
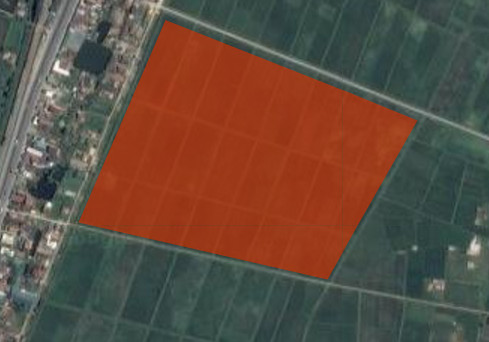
Step 11: Draw a polygon on a know landuse class (Rice is our case).
Note: Do note make your training areas to large, this will result in a computational time out.
Step 12: repeat this for two other areas with the same landuse.
Step 13: Go to the settings of the layer

Step 14: change the selection to FeatureCollection and add the property class with value 1.

Step 15: Click add layer under geometry imports.
Step 16: Repeat this procedure (from step 10) for a number of other landuse classes. Chose a different value for properties each time you create a new layer.
Step 17: Merge all training features into a new imagecollection.
// merge all into a single ImageCollection
var trainingFeatures = rice  //1
.merge(urban)                //2
.merge(water)                //3
.merge(rich_forest)          //4
.merge(secondary_forest)     //5
.merge(agriculture)
Step 18: Include the code below to create your classified image
// sample the regions
var classifierTraining = TrainingImage.select(predictionBands).sampleRegions({collection: trainingFeatures, properties: ['class'], scale: 30 });

// train the classifier
var classifier = ee.Classifier.cart()
.train({features:classifierTraining, classProperty:'class', inputProperties: predictionBands});

// get the classified image
var classified = TrainingImage.select(predictionBands).classify(classifier);
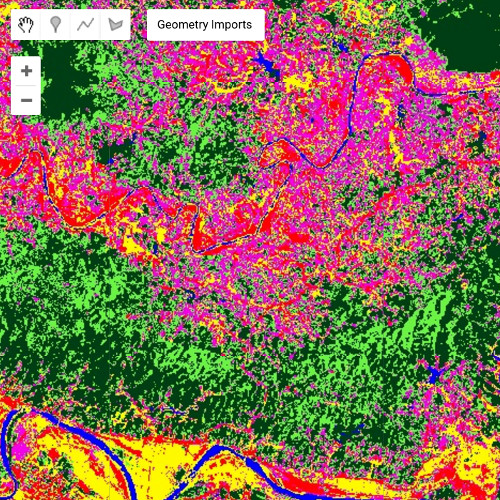
Step 19: add the classified image to the map
// add layer to map
Map.addLayer(classified, {min: 1, max: 6,
palette: ['fffa00' //1
,'#ff0004' //2
,'0000ff' //3
, '003f15' //4
, '6bf442' //5
, 'f402ec']}, //6
'classified');
Step 20: There are a large number of classifiers. Also try some of the classifiers below.
var classifier = ee.Classifier.cart()
var classifier = ee.Classifier.continuousNaiveBayes()
var classifier = ee.Classifier.gmoMaxEnt()
var classifier = ee.Classifier.ikpamir() .
var classifier = ee.Classifier.minimumDistance()
var classifier = ee.Classifier.naiveBayes()
var classifier = ee.Classifier.pegasosGaussian()
var classifier = ee.Classifier.pegasosLinear()
var classifier = ee.Classifier.pegasosPolynomial()
var classifier = ee.Classifier.perceptron()
var classifier = ee.Classifier.svm()
var classifier = ee.Classifier.winnow()
See an example here

Hi! Is there a possibility to put a legend for the classification? If so, can you post a tutorial?
LikeLike
Please have a look here: https://mygeoblog.com/2016/12/09/add-a-legend-to-to-your-gee-map/
LikeLike
Hallo. How can I layerstack images from two different months into one image? I need to layerstack a February and April image. Thanks
LikeLike
You can apply a filter for February and April and merge the results.
LikeLike
Hi, I was just wondering if the codes mentioned in this exercise can also be used for Landsat 7 and/or Landsat 5 or 4?
LikeLike
Sure. But note that the band designations differ.
LikeLike
thanks, yeah i got that. i saw that you also put a variable for sentinel 2 when i opened your sample link. what did you use if for?
LikeLike
It is redundant, so I removed it. You could apply the same algorithm to sentinel-2
LikeLike
do you mean, the codes can also be applied for sentinel 2? (well of course except for the bands)
LikeLike
That’s right.
LikeLike
another question, is there another way to sharpen the images to make it clearer? I am finding it hard to classify different land Use
LikeLike
No. The spatial resolution of Landsat is 30 meter. You can use sentinel-2 for a higher spatial resolution.
Also, you can do the identification on the Google Maps Satellite view. Zoom in and you will get layers with aerial images.
LikeLike
what if i want to map from previous years (e.g. i want to to do a land use change analysis between the year 2007 and 2017) can i still use the google maps satellite view? (i know its a stupid question but i just want to put it out there)
LikeLike
Only if the land cover is the same. That’s why field measurements are so important. You might wanna have a look at the collect earth online initiative where crowd source observations are integrated with rs technologies to create landuse maps
LikeLike