
Use the GEE python api to export your data to numpy and store the result as a geotif.
import ee
import numpy as np
from osgeo import gdal
from osgeo import osr
import time
# init the ee object
ee.Initialize()
# Define the area
area = ee.Geometry.Polygon([[[105.532,19.059],[105.606,19.058],[105.605,19.108],[105.530,19.110],[105.532,19.059]]])
# define the image
img = ee.Image("COPERNICUS/S2/20160209T034234_20160209T090731_T48QWG")
# do any ee operation here
ndvi = ee.Image(img.normalizedDifference(['B8', 'B4']))
timedate = img.get('GENERATION_TIME').getInfo()
# get the lat lon and add the ndvi
latlon = ee.Image.pixelLonLat().addBands(ndvi)
# apply reducer to list
latlon = latlon.reduceRegion(
reducer=ee.Reducer.toList(),
geometry=area,
maxPixels=1e8,
scale=20);
# get data into three different arrays
data = np.array((ee.Array(latlon.get("nd")).getInfo()))
lats = np.array((ee.Array(latlon.get("latitude")).getInfo()))
lons = np.array((ee.Array(latlon.get("longitude")).getInfo()))
# get the unique coordinates
uniqueLats = np.unique(lats)
uniqueLons = np.unique(lons)
# get number of columns and rows from coordinates
ncols = len(uniqueLons)
nrows = len(uniqueLats)
# determine pixelsizes
ys = uniqueLats[1] - uniqueLats[0]
xs = uniqueLons[1] - uniqueLons[0]
# create an array with dimensions of image
arr = np.zeros([nrows, ncols], np.float32) #-9999
# fill the array with values
counter =0
for y in range(0,len(arr),1):
for x in range(0,len(arr[0]),1):
if lats[counter] == uniqueLats[y] and lons[counter] == uniqueLons[x] and counter < len(lats)-1:
counter+=1
arr[len(uniqueLats)-1-y,x] = data[counter] # we start from lower left corner
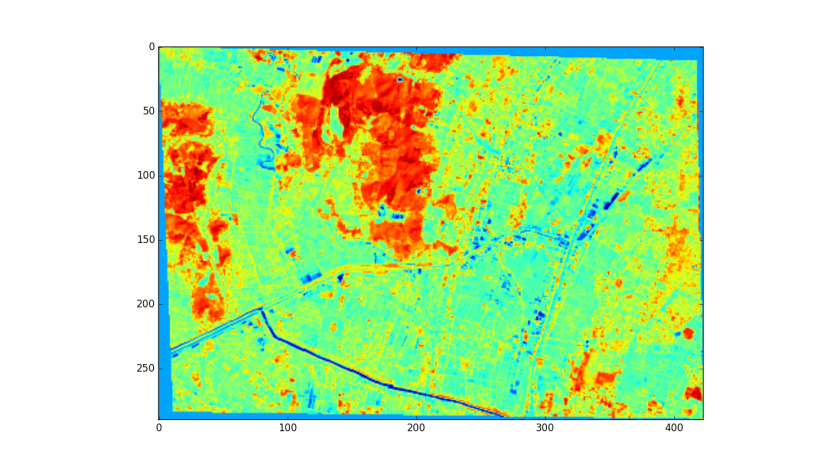
# in case you want to plot the image
import matplotlib.pyplot as plt
plt.imshow(arr)
plt.show()
# set the
#SetGeoTransform((originX, pixelWidth, 0, originY, 0, pixelHeight))
transform = (np.min(uniqueLons),xs,0,np.max(uniqueLats),0,-ys)
# set the coordinate system
target = osr.SpatialReference()
target.ImportFromEPSG(4326)
# set driver
driver = gdal.GetDriverByName('GTiff')
timestring = time.strftime("%Y%m%d_%H%M%S")
outputDataset = driver.Create("/path/to/output.tif", ncols,nrows, 1,gdal.GDT_Float32)
# add some metadata
outputDataset.SetMetadata( {'time': str(timedate), 'someotherInfo': 'lala'} )
outputDataset.SetGeoTransform(transform)
outputDataset.SetProjection(target.ExportToWkt())
outputDataset.GetRasterBand(1).WriteArray(arr)
outputDataset.GetRasterBand(1).SetNoDataValue(-9999)
outputDataset = None

Thank you for the example, I’m impressed with this idea (GEE -> GeoTIFF). What is the license of your code? Can I use part of the script in my own code?
LikeLiked by 1 person
Sure. Please feel free to use all on this blog.
LikeLike
Thanks, I also want to use some of your script in my own code
LikeLike
Hey, I appreciate this code example- great job! I attempted to use a similar process on my own problem- fitting a double logistic curve to an annual stack of MODIS NDVI images. It works, but it appears that the computations are being done locally as opposed to on GEE’s servers. I essentially use your code up until the:
# determine pixelsizes
ys = uniqueLats[1] – uniqueLats[0]
xs = uniqueLons[1] – uniqueLons[0]
Then I proceed with my curve-fit using lmfit. However if I scale this up to anything more than a 1×1 degree block, I overshoot memory limits, which I assume is a local machine issue, not a GEE issue. Whatever the issue, it is foggy to me at what point computations are done on my machine vs. GEE’s servers. I think I have to convert from the imagecollection to a stack of arrays in order for it to work, and lmfit is not available in GEE through javascript. Any ideas what I’m missing?
LikeLike
What does nd represents here, because when I try to the same thing for 1 band, the errors pops as latlon has no key “nd”
LikeLike
It is the Band name corresponding to the dataset being processed, it differs dataset to dataset and can be obtained using dataset.getInfo()
LikeLike
Thank you for this tutorial. Super helpful. I will do this instead of exporting to Drive or Cloud Storage
LikeLike
Thanks for this tutorial. It is well described and easy to understand. I just have one problem. Sometimes I find that the array length of data & lats/lons are not equal and this results in error while running the “for” loop. Is this because of some missing values in the data (nan). How can we deal with this issue? Thanks in advance.
LikeLike
Hi,
thank you for this great code snippet!
It seems to me though that whenever the lower left corner contains “nan” values, line 57
arr[len(uniqueLats)-1-y,x] = data[counter]
throws an IndexError:
index 10507 is out of bounds for axis 0 with size 10507.
Somebody else experiencing this issue/found a solution to it?
LikeLike
This works for only one band, what if you need all image bands?
LikeLike