
Map canopy cover for the period 2000 – 2017
step 1: add a geometry to the map
step 2: add the area of interest
// set the area of interest
var chl = ee.FeatureCollection("users/servirmekong/Vietnam/CHL_Boundary").geometry();
step 3: import the tree canopy cover image collection
// import tree canopy cover
var cc = ee.ImageCollection("projects/servir-mekong/yearly_primitives_smoothed/tree_canopy");
step 4: set period of interest
// set year of interest
var year = 2017;
var startDate = ee.Date.fromYMD(year,1,1);
var endDate = ee.Date.fromYMD(year,12,31);
step 5: filter for date to get the image
// get image for the year
var ccImage = ee.Image(cc.filterDate(startDate,endDate).first());
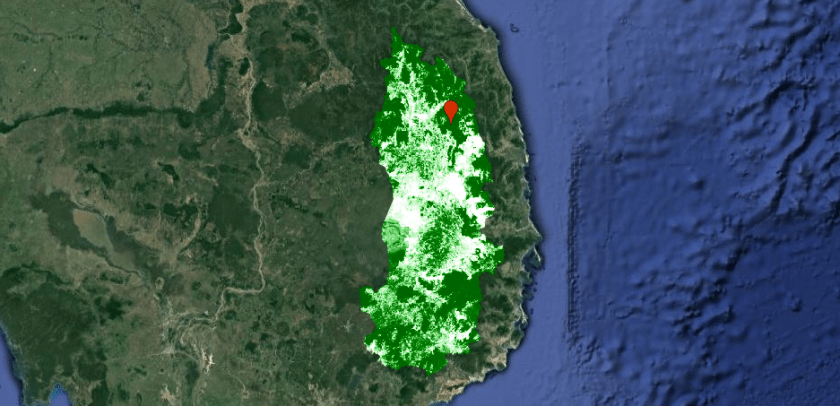
step 6: add the image to the map
Map.addLayer(ccImage.clip(chl),{min:0,max:100,palette:"white,lightgreen,green,darkgreen"});
step 7: add a chart to get the timeseries.
print(ui.Chart.image.series(cc, geometry, ee.Reducer.mean(), 30, 'system:time_start')
.setSeriesNames(['cc'])
.setOptions({
title: 'Canopy cover',
lineWidth: 1,
pointSize: 3,
}));

How to make tree canopy map
LikeLike