
Normalized Difference Vegetation Index (NDVI)
Purpose
The purpose of this hands-on is to give you a tour of spectral indices that can be used to enhance phenomena of interest in remotely sensed images. You will be introduced to methods for creating vegetation, and water, indices. At the completion of the hands-on, you will be able to implement spectral indices and transforms to accentuate the information of interest in your study area.
Healthy Vegetation
Our eyes perceive a leaf as green because wavelengths in the green region of the spectrum are reflected by pigments in the leaf, while the other visible wavelengths are absorbed. In addition, the components in plants reflect, transmit, and absorb different portions of the near-infrared radiation that we cannot see.
Reflected near-infrared radiation can be sensed by satellites, allowing scientists to study vegetation from space. Healthy vegetation absorbs blue- and red-light energy to fuel photosynthesis and create chlorophyll. A plant with more chlorophyll will reflect more near-infrared energy than an unhealthy plant. Thus, analyzing a plants spectrum of both absorption and reflection in visible and in infrared wavelengths can provide information about the plants’ health and productivity. (credit: https://science.nasa.gov/ems/08_nearinfraredwaves)
An illustration below shows the internal structure of a leaf and indicates red, gree, blue, and infrared light energy interact with the leaf structure. The red and blue light is absorbed, green light is reflected by the top layer of the mesophyll and the infrared energy is reflected off the bottom layer.
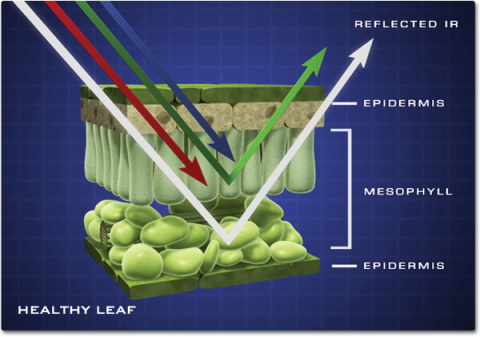
Credit: Jeff Carns
Normalized Difference Vegetation Index (NDVI)
Suppose now that you want to compute a Normalized Difference Vegetation Index (NDVI) image from the Landsat image. Vegetation reflects light in the near-infrared (NIR) part of the electromagnetic spectrum and absorbs light in the red part. NDVI uses this to create a single value roughly reflecting the photosynthetic activity occurring at a pixel. The calculation is
NDVI = (NIR – red) / (NIR + red)
Where NIR and red refer to reflectance, radiance or DN at the respective wavelength. This results in a number between 1 and -1, where pixels with high photosynthetic activity have a high NDVI.
The NDVI can be calculated in Earth Engine with the normalizedDifference() method.
Now, let’s write some lines of code to import the satellite images and calculate the NDVI for two time periods.
1. First, import the Landsat 7 and 8 Surface Reflectance collection as landsat7 and landsat8 as well as the StudyArea. Type or copy/paste the code below into the code editor.
// Import the Landsat 7 and 8 Surface Reflectance collection as landsat7 and landsat8
// Import the study area as Study Area
var landsat7 = ee.ImageCollection("LANDSAT/LE07/C01/T1_SR"),
    landsat8 = ee.ImageCollection("LANDSAT/LC08/C01/T1_SR"),
    StudyArea = ee.FeatureCollection("users/aj/Shapefile/StudyArea");
2. Then filter the image collection by StudyArea using filterBounds() method and by a length of time using the filterDate() method. And sort the collection by cloud cover metadata to obtain only one image with least cloud. Since we aim to map the vegetation for two different time periods, we will specify a start and end date of year 2000 for landsat 7 and year 2015 for landsat8.
// Filter the image collection using filterBounds() and filterDate() method.
// Sort the collection by cloud cover metadata.
var image_ls7 = ee.Image(landsat7
  .filterBounds(StudyArea)
  .filterDate('2000-01-01', '2000-12-31')
  .sort('CLOUD_COVER')
  .first());

var image_ls8 = ee.Image(landsat8
  .filterBounds(StudyArea)
  .filterDate('2015-01-01', '2015-12-31')
  .sort('CLOUD_COVER')
  .first());
3. Clips an image to a study area.
// Clip the image to StudyArea
var image_ls7_clip = image_ls7.clip(StudyArea);
var image_ls8_clip = image_ls8.clip(StudyArea);
4. Calculate the NDVI using the normalizedDifference() method. The normalized difference is computed as (NIR – red) / (NIR + red). For Landsat 7, the NIR is band 4, and the red is band 3. For Landsat 8, the NIR is band 5, and the red is band 4.
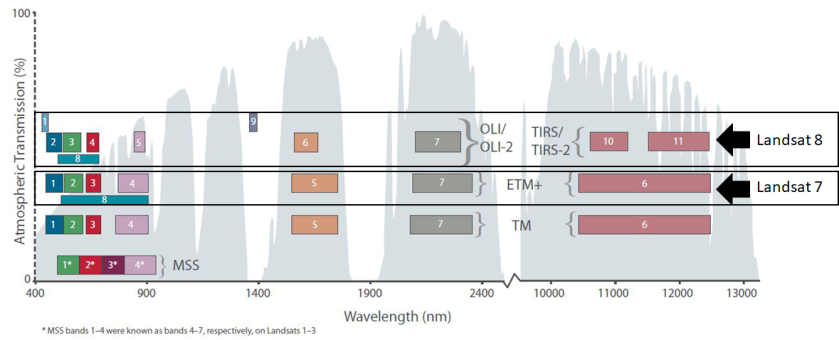
Credit: https://landsat.usgs.gov/what-are-band-designations-landsat-satellites
// Compute the NDVI
var ndvi_ls7 = image_ls7_clip.normalizedDifference(['B4', 'B3']);
var ndvi_ls8 = image_ls8_clip.normalizedDifference(['B5', 'B4']);
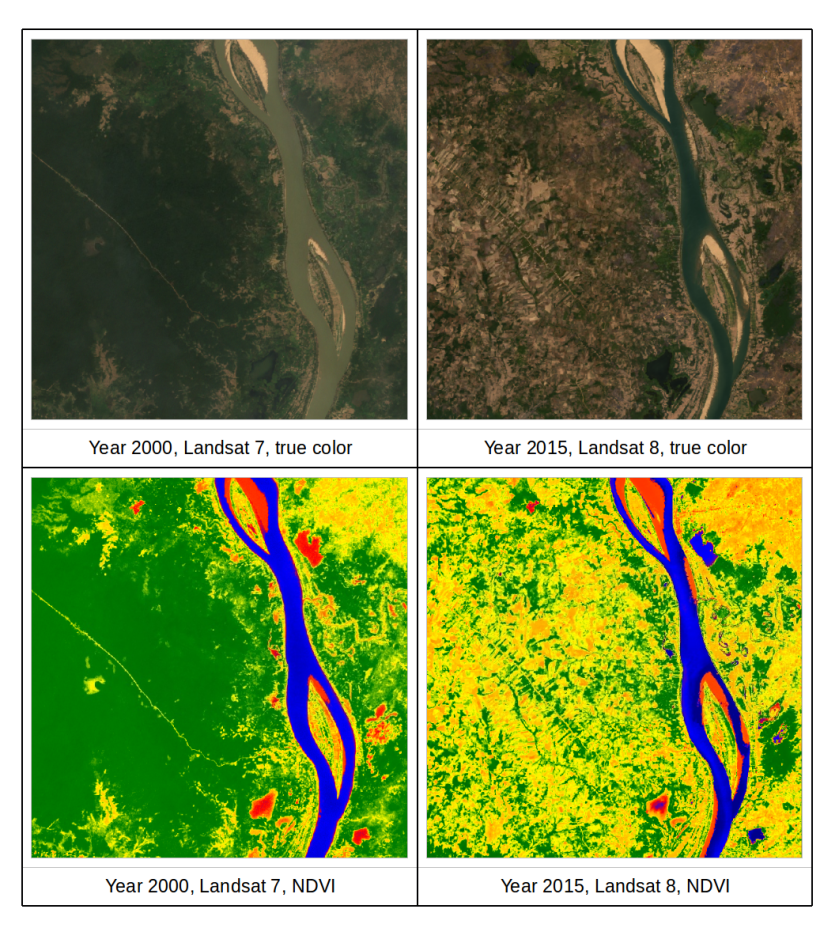
5. Display the true color images and false color NDVI images. Click on the Run button. You should see the resulting images similar to the figure below. Toggle on/off layers to see the difference. Use the Inspector to check pixel values in areas of vegetation and non-vegetation and compare them between year 2000 and 2015.
// Display the true color images
var trueColor_ls7 = {bands: ['B3', 'B2', 'B1'], min: 0, max: 3000};
Map.addLayer(image_ls7_clip, trueColor_ls7, 'Landsat7 yr2000 true color');
var trueColor_ls8 = {bands: ['B4', 'B3', 'B2'], min: 0, max: 3000};
Map.addLayer(image_ls8_clip, trueColor_ls8, 'Landsat8 yr2015 true color');
// Display the NDVI images with a color palette (feel free to make a better one)
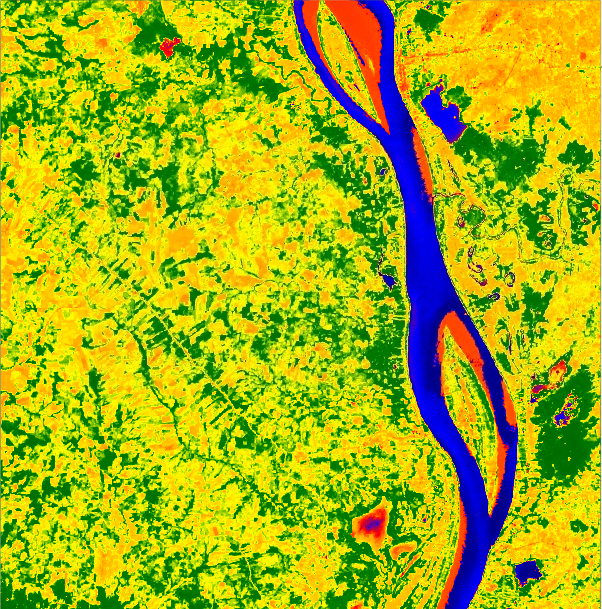
var vegPalette = ['darkblue', 'blue', 'red', 'orange', 'yellow', 'green', 'darkgreen'];
Map.addLayer(ndvi_ls7, {min: -0.4, max: 0.9, palette: vegPalette}, 'Landsat7 yr2000 NDVI');
Map.addLayer(ndvi_ls8, {min: -0.4, max: 0.9, palette: vegPalette}, 'Landsat8 yr2015 NDVI');
Map.centerObject(StudyArea, 12);
The complete code can be found here.
https://code.earthengine.google.com/99612239d594b88065076f550ed9ffbe

Hi @thisearthsite! Thanks for the extensive information and super useful tutorials that you have been sharing for free here. Lately I noticed that you have posted contents related to Cambodia. I am wondering if you have a certain project going on there because I am starting one in Siem Reap province. If you do and wouldn’t mind, may I ask for your contact information please? Keep up the interesting posts and tutorials!
Cheers,
Adrian
LikeLike