

sampling your composite
The code snippets below describe how to import the data, calculate the covariates, sample the data and export the data.
step 1: copy the functions to calculate the covariates to your script.
/*Copyright (c) 2019 SERVIR-Mekong

Permission is hereby granted, free of charge, to any person obtaining a copy
of the data and associated documentation files, to deal in the data
without restriction, including without limitation the rights to use, copy, modify,
merge, publish, distribute, sublicense, and/or sell copies, and to permit persons
to whom the data is furnished to do so, subject to the following conditions:

The above copyright notice and this permission notice shall be included in all
copies or substantial portions of the Software.

THE DATA IS PROVIDED "AS IS", WITHOUT WARRANTY OF ANY KIND, EXPRESS OR
IMPLIED, INCLUDING BUT NOT LIMITED TO THE WARRANTIES OF MERCHANTABILITY,
FITNESS FOR A PARTICULAR PURPOSE AND NONINFRINGEMENT. IN NO EVENT SHALL THE
AUTHORS OR COPYRIGHT HOLDERS BE LIABLE FOR ANY CLAIM, DAMAGES OR OTHER
LIABILITY, WHETHER IN AN ACTION OF CONTRACT, TORT OR OTHERWISE, ARISING FROM,
OUT OF OR IN CONNECTION WITH THE SOFTWARE OR THE USE OR OTHER DEALINGS IN THE
SOFTWARE.*/

var ndCovariatesList = [
  ['blue', 'green'],
  ['blue', 'red'],
  ['blue', 'nir'],
  ['blue', 'swir1'],
  ['blue', 'swir2'],
  ['green', 'red'],
  ['green', 'nir'],
  ['green', 'swir1'],
  ['green', 'swir2'],
  ['red', 'swir1'],
  ['red', 'swir2'],
  ['nir', 'red'],
  ['nir', 'swir1'],
  ['nir', 'swir2'],
  ['swir1', 'swir2']
];

var rCovariatesList = [
  ['swir1', 'nir'],
  ['red', 'swir1']
];

var ComputeNDCovariatesList = function () {
  var list = [];
  for (var index in ndCovariatesList) {
    var list_ = [ndCovariatesList[index][0], ndCovariatesList[index][1]];
    list.push(list_);
  }
  return list;
};

var addNDCovariates = function (image){
  var list = ComputeNDCovariatesList();
  print(list)
  for (var index in list) {
    image = image.addBands(image.normalizedDifference(list[index]).rename('ND_'+ ndCovariatesList[index][0] + '_' + ndCovariatesList[index][1]));
  }
  return image;
};

var ComputeRCovariatesList = function () {
  var list = [];
  for (var index in rCovariatesList) {
    var list_ = [rCovariatesList[index][0], rCovariatesList[index][1]];
    list.push(list_);
  }
  return list;
};

var addRCovariates = function (image) {
  var list = ComputeRCovariatesList();
  for (var index in list) {
    image = image.addBands(image.select(list[index][0]).divide(image.select(list[index][1]))
            .rename('_R_' + rCovariatesList[index][0] + '_' + rCovariatesList[index][1]));
  }
  return image;
};

var addTopography = function (image) {

  // Calculate slope, aspect and hillshade
  var topo = ee.Algorithms.Terrain(elevation);

  // From aspect (a), calculate eastness (sin a), northness (cos a)
  var deg2rad = ee.Number(Math.PI).divide(180);
  var aspect = topo.select(['aspect']);
  var aspect_rad = aspect.multiply(deg2rad);
  var eastness = aspect_rad.sin().rename(['eastness']).float();
  var northness = aspect_rad.cos().rename(['northness']).float();

  // Add topography bands to image
  topo = topo.select(['elevation','slope','aspect']).addBands(eastness).addBands(northness);
  image = image.addBands(topo);
  return image;
};

var addJRCDataset = function (image) {
  // Update the mask.
  jrcImage = jrcImage.unmask(0);

  image = image.addBands(jrcImage.select(['occurrence']).rename(['occurrence']));
  image = image.addBands(jrcImage.select(['change_abs']).rename(['change_abs']));
  image = image.addBands(jrcImage.select(['change_norm']).rename(['change_norm']));
  image = image.addBands(jrcImage.select(['seasonality']).rename(['seasonality']));
  image = image.addBands(jrcImage.select(['transition']).rename(['transition']));
  image = image.addBands(jrcImage.select(['max_extent']).rename(['max_extent']));

  return image;
};

var addEVI = function (image) {
  var evi = image.expression('2.5 * ((NIR - RED) / (NIR + 6 * RED - 7.5 * BLUE + 1))', {
    'NIR' : image.select('nir'),
    'RED' : image.select('red'),
    'BLUE': image.select('blue')
  }).float();
  return image.addBands(evi.rename('EVI'));
};

var addSAVI = function (image) {
  // Add Soil Adjust Vegetation Index (SAVI)
    // using L = 0.5;
    var savi = image.expression('(NIR - RED) * (1 + 0.5)/(NIR + RED + 0.5)', {
    'NIR': image.select('nir'),
    'RED': image.select('red')
    }).float();
    return image.addBands(savi.rename('SAVI'));
};

var addIBI = function (image) {
  // Add Index-Based Built-Up Index (IBI)
  var ibiA = image.expression('2 * SWIR1 / (SWIR1 + NIR)', {
    'SWIR1': image.select('swir1'),
    'NIR'  : image.select('nir')
  }).rename(['IBI_A']);

  var ibiB = image.expression('(NIR / (NIR + RED)) + (GREEN / (GREEN + SWIR1))', {
    'NIR'  : image.select('nir'),
    'RED'  : image.select('red'),
    'GREEN': image.select('green'),
    'SWIR1': image.select('swir1')
  }).rename(['IBI_B']);

  var ibiAB = ibiA.addBands(ibiB);
  var ibi = ibiAB.normalizedDifference(['IBI_A', 'IBI_B']);
  return image.addBands(ibi.rename(['IBI']));
};
Step 2: import the data
// import data
var elevation = ee.Image("USGS/SRTMGL1_003");
var jrcImage = ee.Image("JRC/GSW1_0/GlobalSurfaceWater");
var composites = ee.ImageCollection("projects/servir-mekong/yearlyComposites");
var riceData = ee.FeatureCollection("projects/servir-mekong/referenceData/cambodiaRice");
var tccCollection = ee.ImageCollection("projects/servir-mekong/UMD/tree_canopy");
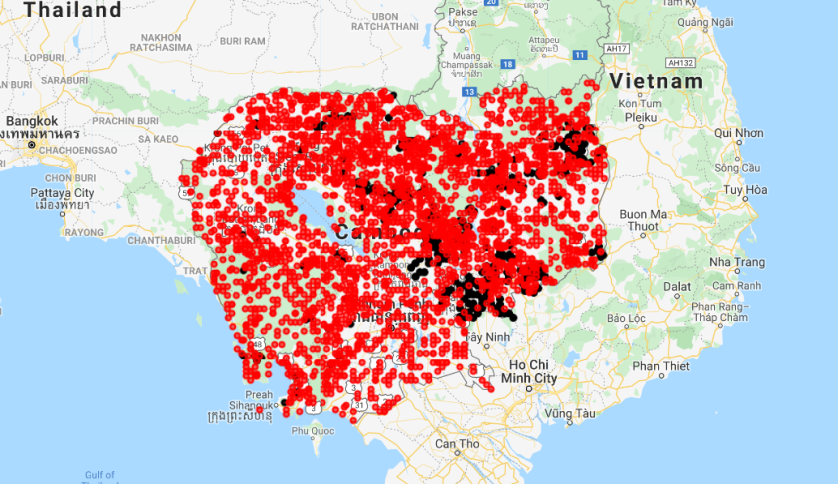
Step 3: Show data for rice and other.
// select rice and no rice
var rice = riceData.filter(ee.Filter.eq("land_class",1));
var norice = riceData.filter(ee.Filter.eq("land_class",0));

Map.addLayer(rice,{},"rice");
Map.addLayer(norice.draw("red"),{},"no rice");
Step 4: make a list containing all years with reference data
// create a list with years
var years = ee.List.sequence(2000,2018,1);
Step 5: pull the image composite for each year, add the covariates and sample the composite with reference data of that year.
// sample the composite for each year
var trainingData = ee.FeatureCollection(years.map(function(y){
    var start = ee.Date.fromYMD(y,1,1);
    var end = ee.Date.fromYMD(y,12,31);

    var image = ee.Image(composites.filterDate(start,end).first()).divide(10000);
    var tcc = ee.Image(tccCollection.filterDate(start,end).first()).rename("tcc");

    image = image.addBands(tcc);

    image = addEVI(image);
    image = addSAVI(image);
    image = addIBI(image);
    image = addTopography(image);
    image = addJRCDataset(image);
    image = addNDCovariates(image);

    var trainingData  = riceData.filter(ee.Filter.eq("year",y));
    var training = image.sampleRegions({collection:trainingData,properties:["land_class"],scale:30,geometries:true});
    return training.toList(training.size());
}).flatten());
Step 6: Export the data.
Export.table.toAsset({collection:trainingData,description:"rice",assetId:"your/asset/Training"});

is it possible to collect the data without a ground survey? I am from Nepal and trying to create the rice map for Nepal can you give some ideas
LikeLike
you can use collect earth.. https://collect.earth/ to collect field data. Or you could touch base with ICIMOD, they have a lot of field data and landcover maps on rice..
LikeLike
I have been following your blog and mostly code you have used the yearly composite which is not shared and no details about it?
LikeLike