
Use autocorelation between EVI and Rainfall to figure it out.
Step 1: Import EVI and Chirps data layers
// Precipitation
var chirps = ee.ImageCollection('UCSB-CHG/CHIRPS/PENTAD');

// import MODIS EVI
var EVI = ee.ImageCollection("MODIS/MYD13A1").select("EVI");
Step 2: Import the area of interest.
// countries of interest
var country_names = ['Myanmar (Burma)','Thailand','Laos','Vietnam','Cambodia'];
var countries = ee.FeatureCollection('ft:1tdSwUL7MVpOauSgRzqVTOwdfy17KDbw-1d9omPw');
var mekongCountries = countries.filter(ee.Filter.inList('Country', country_names));
var roi = mekongCountries.geometry();
Step 3: Define number of lag days
// define number of lagdays
var lagdays = 30;
Step 4 Define period of interest.
// set start and end date
var startdate = ee.Date.fromYMD(2000,1,1);
var enddate = ee.Date.fromYMD(2005,12,31);
var year = 2010;

// filter based on date
var EVI = EVI.filterDate(startdate,enddate);
var chirps = chirps.filterDate(startdate,enddate);
Step 5: Created a lagged collection
// Autocovariance and autocorrelation ---------------------------------------------
// Function to get a lagged collection. Images that are within
// lagDays of image are stored in a List in the 'images' property.
var lag = function(leftCollection, rightCollection, lagDays) {
 var filter = ee.Filter.and(
 ee.Filter.maxDifference({
 difference: 1000 * 60 * 60 * 24 * lagDays,
 leftField: timeField,
 rightField: timeField
 }),
 ee.Filter.greaterThan({
 leftField: timeField,
 rightField: timeField
 }));

 return ee.Join.saveAll({
 matchesKey: 'images',
 measureKey: 'delta_t',
 ordering: timeField,
 ascending: false, // Sort reverse chronologically
 }).apply({
 primary: leftCollection,
 secondary: rightCollection,
 condition: filter
 });
};
Step 6: apply the lagged function
// Advanced cross-correlation----------------------------------------------------
// Join the precipitation images from the previous month
var lag30PrecipEVI = lag(EVI, chirps, lagdays);
Step 7: add the sum of the lagged image collection as a band.
</pre>

// calculate the sum of lagged image collection and ass them as a band
var sum30PrecipEVI = ee.ImageCollection(lag30PrecipEVI.map(function(image) {
var laggedImages = ee.ImageCollection.fromImages(image.get('images'));
return ee.Image(image).addBands(laggedImages.sum().rename('sum'));
}));

var yearlyPrecipEVI = sum30PrecipEVI.filter(ee.Filter.calendarRange(year, year, 'year'));
<pre>
Step 8: compute covariates.
</pre>

// Function to compute covariance over time. This will return
// a 2x2 array image. Pixels contains variance-covariance matrices.
var covariance = function(mergedCollection, band, lagBand) {
return mergedCollection.select([band, lagBand]).map(function(image) {
return image.toArray();
}).reduce(ee.Reducer.covariance(), 8);
};

var cov30PrecipEVI = covariance(yearlyPrecipEVI, 'EVI', 'sum');
<pre>
Step 9: calculate the correlation.
</pre>

// Compute correlation from a 2x2 covariance image.
var correlation = function(vcArrayImage) {
var covariance = ee.Image(vcArrayImage).arrayGet([0, 1]);
var sd0 = ee.Image(vcArrayImage).arrayGet([0, 0]).sqrt();
var sd1 = ee.Image(vcArrayImage).arrayGet([1, 1]).sqrt();
return covariance.divide(sd0).divide(sd1).rename('correlation');
};

var corr30PrecipEVI = correlation(cov30PrecipEVI).set('system:time_start',ee.Date.fromYMD(year,1,1));
<pre>
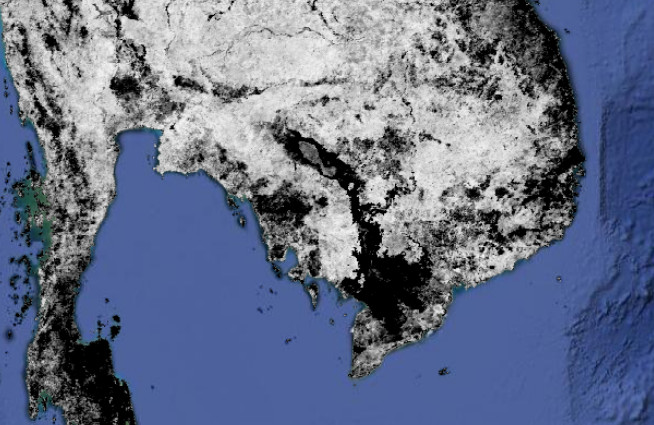
Step 10: Add the map.
Map.addLayer(corr30PrecipEVI)
Assignment 1:
Investigate the irrigated and non irigated areas. Which one has the highest autocorrelation?
Assignment 2:
Do the same analysis for 2011.
Follow this url for the full code.

Wow, great example.
I was just wondering whether it is possible to lag months as appose to days – for example if you want to determine the delay period between precipitation and streamflow?
Pretty please 🙂
LikeLike