
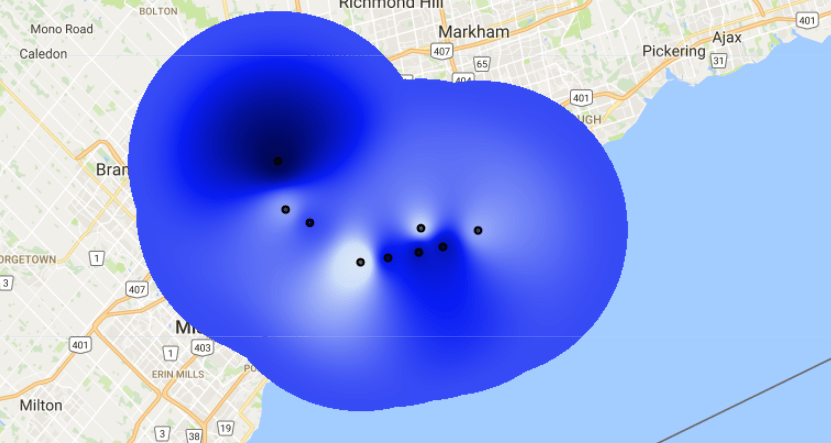
Interpolate your point data.
See example here.
//Script name: Rainfall Toronto
//PURPOSE:  IDW Interpolation
//SENSORS: none

// User specified parameters

// vizualization parameters
var viz = {min:0, max:80, palette:['f7f8f9,ccdef9,091df4,000651']};

// Data

// Rainfall stations
var rainfall = ee.FeatureCollection([
  ee.Feature(ee.Geometry.Point(-79.478112,	43.647680), {rain: 15.98}),
  ee.Feature(ee.Geometry.Point(-79.443615,	43.651196), {rain: 57.15}),
  ee.Feature(ee.Geometry.Point(-79.405094,	43.656615), {rain: 63.94}),
  ee.Feature(ee.Geometry.Point(-79.402833,	43.678343), {rain: 26.56}),
  ee.Feature(ee.Geometry.Point(-79.375101,	43.661265), {rain: 63.55}),
  ee.Feature(ee.Geometry.Point(-79.331144,	43.676720), {rain: 34.29}),
  ee.Feature(ee.Geometry.Point(-79.581636,	43.739216), {rain: 79.57}),
  ee.Feature(ee.Geometry.Point(-79.571937,	43.694917), {rain: 35.34}),
  ee.Feature(ee.Geometry.Point(-79.541474,	43.683430), {rain: 47.04}),
]);

// Functions

// Estimate global mean from the points.
var meanstats = rainfall.reduceColumns({
  reducer: 'mean',
  selectors: ['rain']
});

// Estimate standard deviation (SD) from the points.
var SDstats = rainfall.reduceColumns({
  reducer: 'stdDev',
  selectors: ['rain']
});

// Do the interpolation, valid to 15 kilometers.
var interpolatedRain = rainfall.inverseDistance({
  range: 15000,
  propertyName: 'rain',
  mean: meanstats.get('mean'),
  stdDev: SDstats.get('stdDev'),
});

// Add to map
Map.centerObject(rainfall,10);
Map.addLayer(interpolatedRain,viz,"Interpolated rainfall");
Map.addLayer(rainfall,{},"Monthly Rainfall");

How to set the cell size of interpolated image?
LikeLike