
Explore temporal variation in EVI
Copy the script below and fill out the ??
// filter province
var Kalutara = table.filter(ee.Filter.eq("NAME_1","??")).geometry();
// import modis evi data
var EVI = ee.ImageCollection("MODIS/MYD13A1");
// filter for time
var EVI = EVI.filterDate('??', '??').sort('system:time_start', false).select("??");
// clip the image
var meanEVI = EVI.mean().clip(Kalutara)
// display the image
Map.addLayer(meanEVI,{min:0, max: ??, palette: ??}, 'mean EVI');
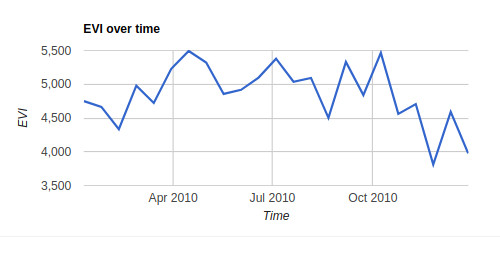
// Predefine the chart titles.
var title = {
title: '??',
hAxis: {title: '??'},
vAxis: {title: '??'},
};
var chart = Chart.image.seriesByRegion(??, ??, ee.Reducer.mean(), 'EVI', 5000, 'system:time_start', 'PROJECT').setOptions(title);
print(??)
