
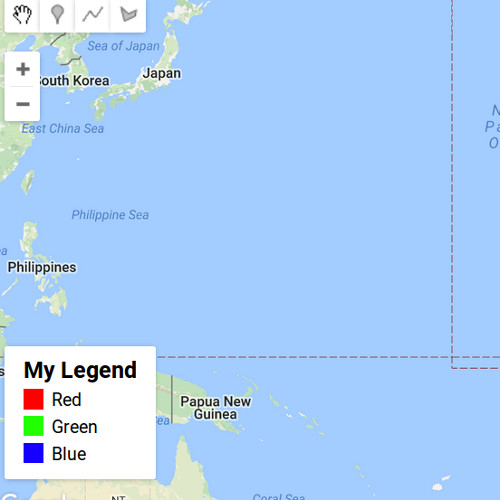
Just to show what the different colours in your map represent.
Add a legend to your Google Earth Engine map as a panel using the code below.
// set position of panel
var legend = ui.Panel({
  style: {
    position: 'bottom-left',
    padding: '8px 15px'
  }
});

// Create legend title
var legendTitle = ui.Label({
  value: 'My Legend',
  style: {
    fontWeight: 'bold',
    fontSize: '18px',
    margin: '0 0 4px 0',
    padding: '0'
    }
});

// Add the title to the panel
legend.add(legendTitle);

// Creates and styles 1 row of the legend.
var makeRow = function(color, name) {

      // Create the label that is actually the colored box.
      var colorBox = ui.Label({
        style: {
          backgroundColor: '#' + color,
          // Use padding to give the box height and width.
          padding: '8px',
          margin: '0 0 4px 0'
        }
      });

      // Create the label filled with the description text.
      var description = ui.Label({
        value: name,
        style: {margin: '0 0 4px 6px'}
      });

      // return the panel
      return ui.Panel({
        widgets: [colorBox, description],
        layout: ui.Panel.Layout.Flow('horizontal')
      });
};

//  Palette with the colors
var palette =['FF0000', '22ff00', '1500ff'];

// name of the legend
var names = ['Red','Green','Blue'];

// Add color and and names
for (var i = 0; i < 3; i++) {
  legend.add(makeRow(palette[i], names[i]));
  }

// add legend to map (alternatively you can also print the legend to the console)
Map.add(legend);
See an example here.

How can I use Corine.get(“land_cover_palette”) to set the var palette?
LikeLike