
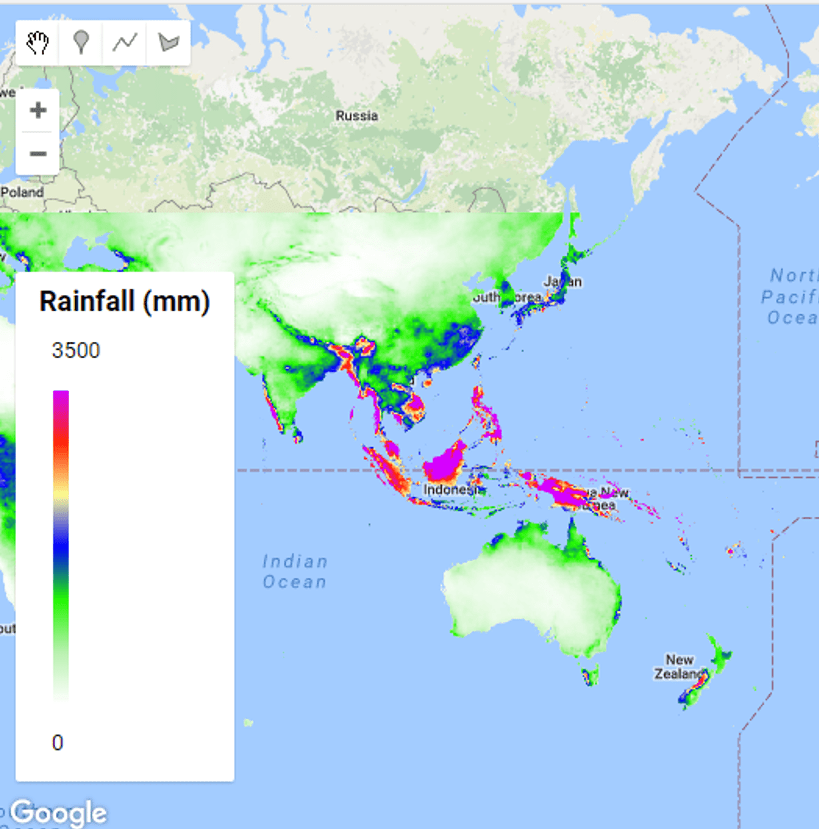
To show what these colors mean
See some example code we used to display global yearly rainfall below.
var chirps = ee.ImageCollection("UCSB-CHG/CHIRPS/PENTAD")

// Calculate rainfall in 2009
var P = chirps.select("precipitation").filterDate('2009-01-01', '2009-12-31').sum()

// create vizualization parameters
var viz = {min:0, max:3500, palette:['ffffff','b7f0ae','21f600','0000FF','FDFF92','FF2700','d600ff']};

// add the map
Map.addLayer(P, viz);

// set position of panel
var legend = ui.Panel({
style: {
position: 'bottom-left',
padding: '8px 15px'
}
});

// Create legend title
var legendTitle = ui.Label({
value: 'Rainfall (mm)',
style: {
fontWeight: 'bold',
fontSize: '18px',
margin: '0 0 4px 0',
padding: '0'
}
});

// Add the title to the panel
legend.add(legendTitle);

// create the legend image
var lon = ee.Image.pixelLonLat().select('latitude');
var gradient = lon.multiply((viz.max-viz.min)/100.0).add(viz.min);
var legendImage = gradient.visualize(viz);

// create text on top of legend
var panel = ui.Panel({
widgets: [
ui.Label(viz['max'])
],
});

legend.add(panel);

// create thumbnail from the image
var thumbnail = ui.Thumbnail({
image: legendImage,
params: {bbox:'0,0,10,100', dimensions:'10x200'},
style: {padding: '1px', position: 'bottom-center'}
});

// add the thumbnail to the legend
legend.add(thumbnail);

// create text on top of legend
var panel = ui.Panel({
widgets: [
ui.Label(viz['min'])
],
});

legend.add(panel);

Map.add(legend);
See a live example here.

Uh any idea how to change the position of max and min of the legend. instead of top and bottom how to change it to left and right?
LikeLike