Normalized Difference Water Index (NDWI)
Rapid damage assessment following a flooding event and/or inland inundation is essential for disaster management to coordinate the first responders and other activities related to response and rehabilitation of damaged infrastructure in a quick manner. The use of Earth Observation (EO) data, specifically satellite data, significantly facilitates the determination of the flood extent for large areas and does not require field work, which would be highly time and labour-intensive.
Flood mapping also benefits from the large availability of satellite data free of charge, such as Sentinel data provided by the European Space Agency (ESA). On the Copernicus Open Access Hub, the user can download Optical as well as Radar satellite data. SAR (synthetic aperture radar) measurements can also be used for flood mapping irrespective of daytime and cloud cover of the scene. (UN-Spider Knowledge Portal)
This hands-on uses Optical satellite data and draws on the spectral reflectances within the Green and NIR channels to calculate the NDWI.
Normalized Difference Water Index (NDWI)
The Normalized Difference Water Index (NDWI) is a new method that has been developed by McFeeters (1996) to delineate open water features and enhance their presence in remotely-sensed digital imagery. The index facilitates the differentiation between water and non-water inundated areas. The NDWI makes use of reflected near-infrared radiation and visible green light to enhance the presence of such features while eliminating the presence of soil and terrestrial vegetation features. It is suggested that the NDWI may also provide researchers with turbidity estimations of water bodies using remotely-sensed digital data.
NDWI = (green – NIR) / (green + NIR)
The NDWI can be calculated in Earth Engine with the normalizedDifference() method.
Now, let’s write some lines of code to import the satellite images and calculate the NDWI for two time periods.
1. First, import the Sentinel-2 MSI: MultiSpectral Instrument, Level-1C collection as sentinel2 and the boundary of Cambodia as bnd_cambodia. Type or copy/paste the code below into the code editor.
// Import the Sentinel 2 collection as sentinel 2
// Import the boundary of Cambodia as bnd_cambodia
var sentinel2 = ee.ImageCollection("COPERNICUS/S2"),
    bnd_cambodia = ee.FeatureCollection("users/aj/Shapefile/BND_Cambodia");
2. Then filter the image collection by bnd_cambodia using filterBounds() method and by a length of time using the filterDate() method. And sort the collection by cloud cover metadata to obtain only images with least cloud. In this hands-on, we aim to map the water area during dry and wet season in 2018, so we will specify a start of January to end of April as a dry season and a start of June to end of October as a wet season (Feel free to change this and compare results). We then create the mosaic image and clip it to Cambodia boundary.
// Filter the image collection using filterBounds() and filterDate() method.
// Sort the collection by cloud cover metadata
var image_dry = sentinel2
                  .filterBounds(bnd_cambodia)
                  .filterDate('2018-01-01', '2018-04-30')
                  .sort('CLOUDY_PIXEL_PERCENTAGE', false)
                  .map(function(image) {
                    return image.addBands(image.metadata('system:time_start'));
                  })
                  .mosaic()
                  .clip(bnd_cambodia);

var image_wet = sentinel2.filterDate('2018-06-01', '2018-10-31')
                  .filterBounds(bnd_cambodia)
                  .sort('CLOUDY_PIXEL_PERCENTAGE', false)
                  .map(function(image) {
                    return image.addBands(image.metadata('system:time_start'));
                  })
                  .mosaic()
                  .clip(bnd_cambodia);
3. Calculate the NDWI using the normalizedDifference() method. The normalized difference is computed as (green – NIR) / (green + NIR). For Sentinel 2, the green is band 3 and the NIR is band 8.

Credit: https://earth.esa.int/web/sentinel/user-guides/sentinel-2-msi/resolutions/spatial
// Calculate NDWI
var ndwi_dry = image_dry.normalizedDifference(['B3', 'B8']);
var ndwi_wet = image_wet.normalizedDifference(['B3', 'B8']);
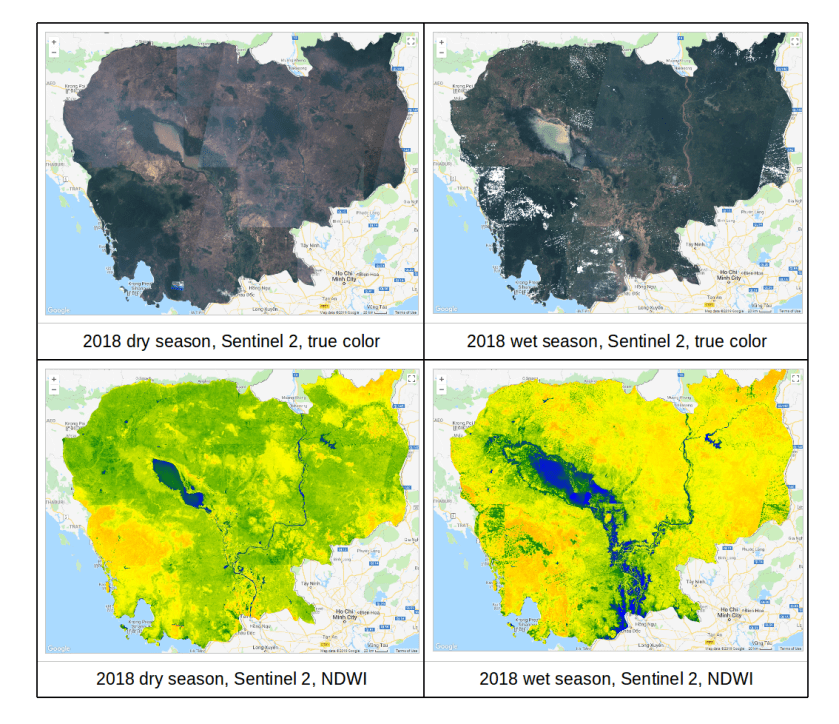
4. Display the true color images and false color NDWI images. Click on the Run button. You should see the resulting images similar to the figure below. Toggle on/off layers to see the difference between dry and wet season.
// Display the true color images
var trueColor_sentinel2 = {bands: ['B4', 'B3', 'B2'], min: 0, max: 3000};
Map.addLayer(image_dry, trueColor_sentinel2, '2018 Dry season true color');
Map.addLayer(image_wet, trueColor_sentinel2, '2018 Wet season true color');

// Display the NDWI images with a color palette (feel free to make a better one)
var waterPalette = ['red', 'yellow', 'green', 'blue'];
Map.addLayer(ndwi_dry, {min: -1, max: 0.5, palette: waterPalette}, '2018 Dry season NDWI');
Map.addLayer(ndwi_wet, {min: -1, max: 0.5, palette: waterPalette}, '2018 Wet season NDWI');
Map.centerObject(bnd_cambodia, 8);
The complete code can be found here.
https://code.earthengine.google.com/495f44097d225c717c8666611b776cd9