
Night Lights!
Urban areas are expanding rapidly in many parts of the world. Urban encroachment upon agricultural and forest lands often leads to environmental degradation and a loss of natural productivity, leading some analysts to suggest that the present rate of urbanization constitutes a global crisis (M. Henderson).
Nighttime data from the Defense Meteorological Satellite Program (DMSP) Operational Linescan System (OLS) and the Visible Infrared Imaging Radiometer Suite (VIIRS) have been widely used to monitor and analyze human activities, urban expansion and natural phenomena around the world (Hasi Bagan).
In this hands-on, we will display the nightlight light images from two data sources:
-
DMSP OLS: Nighttime Lights Time Series Version 4 (Dataset Availability 1992 – Jan 2014) for year 1995 and 2005.
-
VIIRS Stray Light Corrected Nighttime Day/Night Band Composites Version 1 (Dataset Availability Jan 2014 – Present) for year 2015.
We will produce images for three time periods (1995, 2005, and 2015) and examine the development of urban areas.
1. First, import the DMSP-OLS dataset as dataset_DMSP , the VIIRS dataset as dataset_DMSP, and the boundary of Mekong region as bnd_mekong. Type or copy/paste the code below into the code editor.
<span id="mce_SELREST_start" style="overflow:hidden;line-height:0"></span>
// Import the nighttime image collection from DMSP-OLS and VIIRS
// Import the boundary of Mekong region as bnd_mekong
//DMSP-OLS Dataset Availability 1992-01-01T00:00:00 - 2014-01-01T00:00:00
var dataset_DMSP = ee.ImageCollection('NOAA/DMSP-OLS/NIGHTTIME_LIGHTS');
// VIIRS Dataset Availability 2014-01-01T00:00:00 - Present
var dataset_VIIRS = ee.ImageCollection('NOAA/VIIRS/DNB/MONTHLY_V1/VCMSLCFG');
var bnd_mekong = ee.FeatureCollection("users/aj/Shapefile/BND_CLMTV");
2. Filter the image collection by a length of time using the filterDate() method for year 1995, 2005, and 2015. Create the mosaic image and clip it to Mekong region boundary.
// Filter the image collection using filterDate() method for year 1995, 2005, and 2015.
// Create the mosaic image and clip it to Mekong region
var nighttimeLights_1995 = dataset_DMSP
.filterDate('1995-01-01', '1995-12-31')
.mosaic()
.clip(bnd_mekong)
.select('stable_lights');

var nighttimeLights_2005 = dataset_DMSP
.filterDate('2005-01-01', '2005-12-31')
.mosaic()
.clip(bnd_mekong)
.select('stable_lights');

var nighttimeLights_2015 = dataset_VIIRS
.filterDate('2015-01-01', '2015-12-31')
.mosaic()
.clip(bnd_mekong)
.select('avg_rad');
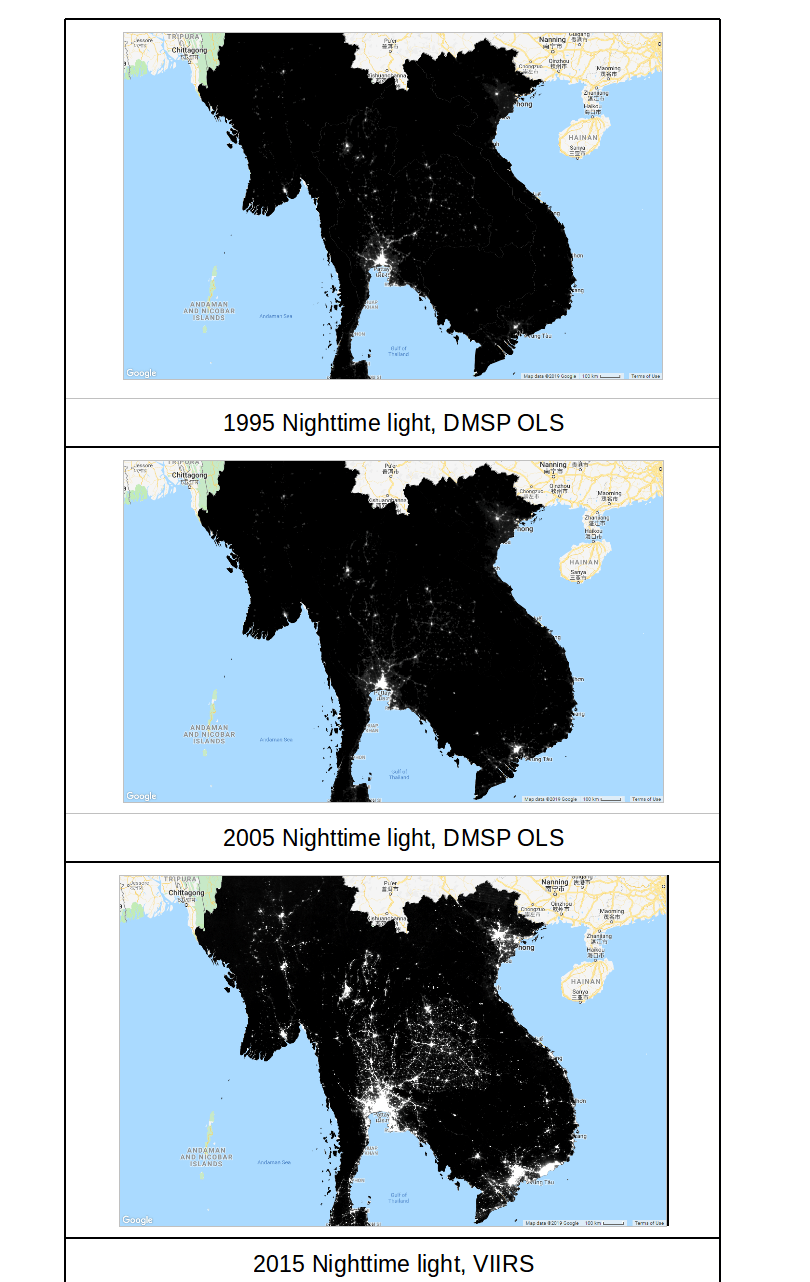
3. Display the nighttime light images of Mekong region. Click on the Run button. You should see the resulting images similar to the figure below. Toggle on/off layers and pan around to see the development of urban areas.
// Display the nighttime light images
var nighttimeVis_DMSP = {min: 0.0, max: 60.0};
var nighttimeVis_VIIRS = {min: 0.0, max: 2.0};

Map.addLayer(nighttimeLights_1995, nighttimeVis_DMSP, 'Nighttime Lights 1995');
Map.addLayer(nighttimeLights_2005, nighttimeVis_DMSP, 'Nighttime Lights 2005');
Map.addLayer(nighttimeLights_2015, nighttimeVis_VIIRS, 'Nighttime Lights 2015');
Map.centerObject(bnd_mekong, 6);
4. What if you want to display the nighttime lights for the entire world? Perhaps you may disable the line that clips an image to Mekong region.
The complete code can be found here.
https://code.earthengine.google.com/be9704a9d1cc722a9fc5246844d1d45a


IS IT POSSIBLE TO CREATE TIME SERIES GRAPH WITH THIS DATA
LikeLike