
Sentinel 2A surface reflectance product
step 1: import the administrative data and select the province of interest.
var cambodia = ee.FeatureCollection("users/servirmekong/countries/KHM_adm1");
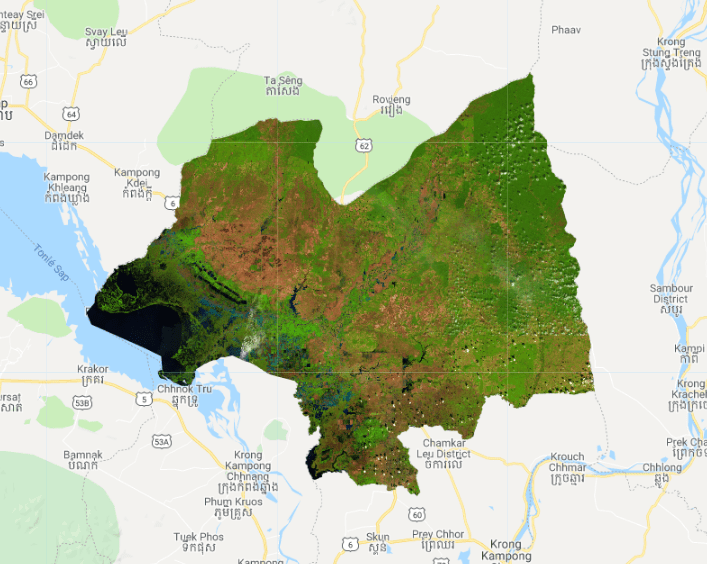
var KampongThum = cambodia.filter(ee.Filter.eq("NAME_1","Kâmpóng Thum")).geometry();
step 2: Set band information.
var inBands = ee.List(['QA60','B1','B2','B3','B4','B5','B6','B7','B8','B8A','B9','B11','B12']);
var outBands = ee.List(['QA60','cb','blue','green','red','re1','re2','re3','nir','re4','waterVapor','swir1','swir2']);
step 3: set time period and cloud filter variables.
var CloudCoverMax = 30;
var startDate = "2018-01-01";
var endDate = "2018-12-31";
var studyArea = KampongThum;
step 4: import the sentinel 2A data.
// Get Sentinel-2 data
var s2 = ee.ImageCollection('COPERNICUS/S2_SR')
.filterDate(startDate,endDate)
.filterBounds(studyArea)
.filter(ee.Filter.lt('CLOUDY_PIXEL_PERCENTAGE',CloudCoverMax))
.filter(ee.Filter.lt('CLOUD_COVERAGE_ASSESSMENT',CloudCoverMax));
step 5: write a function to scale the data.
// scale the data
var scaleData = function scaleBands(img){
var prop = img.toDictionary();
var myImg = img.select(['B1','B2','B3','B4','B5','B6','B7','B8','B8A','B9','B11','B12']).divide(10000);
myImg = myImg.addBands(img.select(['QA60'])).set(prop).copyProperties(img,['system:time_start','system:footprint']);
return ee.Image(myImg);
};
step 6: Scale the data
var s2 = s2.map(scaleData).select(inBands,outBands);
step 7: Display the data
var s2 = s2.map(scaleData).select(inBands,outBands);

Map.addLayer(s2.median().clip(KampongThum),{min:0,max:0.6,bands:"swir1,nir,red"}, "surface reflectance KKampong Thum");
