

Một bản đồ sử dụng đất từ các kho lưu trữ Landsat hoàn chỉnh
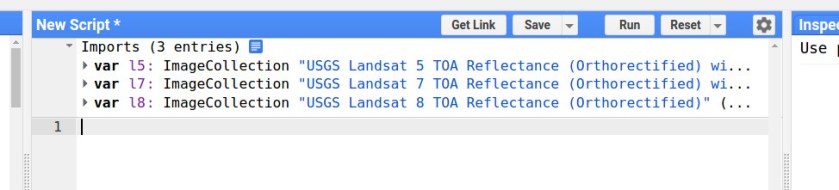
1. Nhập Import tập hợp ảnh Landsat 5, 7 và 8 ImageCollections.
2. Xác định khoảng thời gian cần quan tâm.
// Define time range
var startyear = 2006;
var endyear = 2016;

// Set date in ee date format
var startdate = ee.Date.fromYMD(startyear,1,1);
var enddate = ee.Date.fromYMD(endyear,12,31)
3. Import một fusion table (file vector) của khu vực nghiên cứu mà bạn quan tâm.
// The Ca basin
var Ca = ee.FeatureCollection('ft:1ILFPzWUf4dL_tKNY0Rd3EhGtRQoLfzmk_00i9xC3');
4. Lựa chọn ImageCollections dựa trên thời gian và khu vực quan tâm.
// filter on date and bounds
var l5images = l5.filterDate(startdate,enddate).filterBounds( Ca);
var l7images = l7.filterDate(startdate,enddate).filterBounds( Ca);
var l8images = l8.filterDate(startdate,enddate).filterBounds( Ca);
5. Bao gồm cả hàm để loại bỏ mây
// set cloud threshold
var cloud_thresh = 40;

// Functions
var cloudfunction = function(image){
  //use add the cloud likelihood band to the image
  var CloudScore = ee.Algorithms.Landsat.simpleCloudScore(image);
  //isolate the cloud likelihood band
  var quality = CloudScore.select('cloud');
  //get pixels above the threshold
  var cloud01 = quality.gt(cloud_thresh);
  //create a mask from high likelihood pixels
  var cloudmask = image.mask().and(cloud01.not());
  //mask those pixels from the image
  return image.updateMask(cloudmask);
};
6. Chạy hàm loại bỏ mây cho tất cả các ảnh trong tập hợp ảnh được lựa chọn
// mask all clouds in the image collection
l5images = l5images.map(cloudfunction);
l7images = l7images.map(cloudfunction);
l8images = l8images.map(cloudfunction);
7. Chọn band Red và NIR (cận hồng ngoại).
// Select the red and NIR bands
l5images = l5images.select(["B4","B3"]);
l7images = l7images.select(["B4","B3"]);
l8images = l8images.select(["B5","B4"]);
8. Tính NDVI cho tất cả các ảnh.
// calculate ndvi from landsat 8
function l8ndvi(img) {
  var ndvi = img.normalizedDifference(['B5', 'B4']).rename('NDVI');
  return img.addBands(ndvi);
}

// calculate ndvi from landsat 5 & 7
function l57ndvi(img) {
  var ndvi = img.normalizedDifference(['B4', 'B3']).rename('NDVI');
  return img.addBands(ndvi);
}

// calculate ndwi for each image in imagecollection
var l5ndvi = l5images.map(l57ndvi);
var l7ndvi = l7images.map(l57ndvi);
var l8ndvi = l8images.map(l8ndvi);
9. Gộp tất cả các ảnh vào một bộ sưu tập ảnh .
// combine all data in single image collection
var allcollection =  ee.ImageCollection((l5ndvi.merge(l7ndvi)).merge(l8ndvi));
10. Tính trung bình (Mean) NDVI cho từng tháng.
// create list for years
var months = ee.List.sequence(1,12);

// calculate the ndvi for each month
var monthlyNDVI =  ee.ImageCollection.fromImages(
  months.map(function(m){
  var w = allcollection.select("NDVI").filter(ee.Filter.calendarRange(m, m, 'month'))
           .mean();
  return w.set('year', 2000)
           .set('month', m)
           .set('date', ee.Date.fromYMD(2000,m,1))
           .set('system:time_start',ee.Date.fromYMD(2000,m,1))

}).flatten());
11. Hiển thị ảnh Mean NDVI của tập hợp ảnh đã chọn
// the vizualization settings
var ndvi_viz = {min:0.0, max:0.70, palette:"ffe60a,dfffd1,277005"};

// add map to canvas
Map.addLayer(monthlyNDVI.select("NDVI").mean().clip(Ca),ndvi_viz ,"ndvi")
Find an example here.
Now we are going to plot the temporal signature
12. Dùng công cụ vẽ Select the polygon drawing tool.

13. Vẽ một vùng mẫu cho các lớp sử dụng đất cần quan tâm
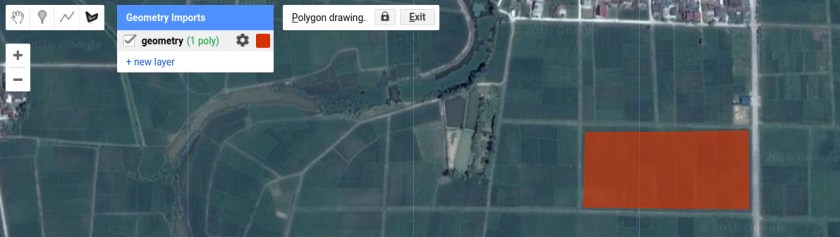
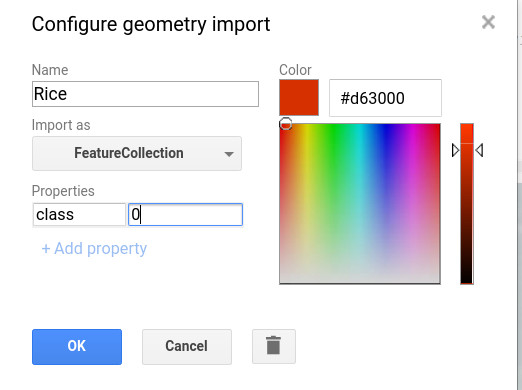
14. Đặt tên cho vùng mẫu. Lựa chọn tập hợp đối tượng có cùng đặc điểm và đặt cho nó cùng 1 giá trị = 0
15. Lặp lại công việc này đối với các lớp khác bằng cách tạo ra new layer. Đảm bảo rằng các lớp khác nhau có giá trị khác nhau
16. Gộp các lớp khác nhau thành 1 tập hợp mẫu
// merge into one feature collection
var mergedtable = rice //0
.merge(urban)               //1
.merge(water)               //2
.merge(richforest)          //3
.merge(annualcrops)         //4
.merge(secondaryforest)     //5
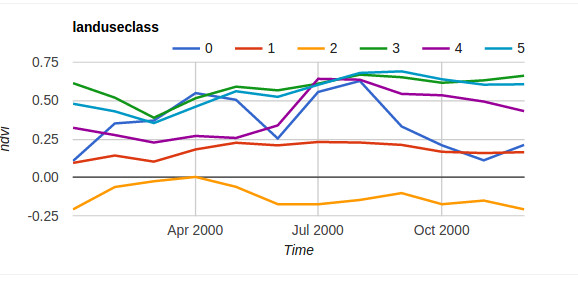
17. Hiển thị mẫu thời gian dưới dạng đồ thị
// Predefine the chart titles.
var title = {
  title: 'landuseclass',
  hAxis: {title: 'Time'},
  vAxis: {title: 'ndvi'},
};

// create chart
var chart = ui.Chart.image.seriesByRegion(monthlyNDVI,
                                          mergedtable,
                                           ee.Reducer.mean(),
                                           'NDVI',
                                           30,
                                           'system:time_start',
                                           'class').setOptions(title);

print(chart);
Bây giờ chúng ta cần đưa thêm vào 12 ảnh (ảnh của mỗi tháng) coi như là một band ảnh của một tập hợp ảnh mới. việc này có thể thực hiện nhờ đoạn code dưới đây.
18. Copy và paste đoạn code này vào Code Editor
// Create a list with months
var monthnames = ["jan","feb","mar","apr","may","jun","jul","aug","sep","oct","nov","dec"]

// make a list of from the imagecollection
var myNDVIlist = monthlyNDVI.select("NDVI").toList(12);

// create a new image from the month January
var myCollection = ee.Image(myNDVIlist.get(0)).rename("jan");

// add the image of each month as band to the image
for (var i = 1; i < myNDVIlist.length().getInfo(); i++) {
  var mymap = ee.Image(myNDVIlist.get(i)).rename(monthnames[i]);
  myCollection = myCollection.addBands(mymap);
}
19. Sử dụng đoạn code dưới đây để phân loại ảnh.
// set training image collection
var TrainingImage = myCollection;

// define training features
var trainingFeatures = mergedtable;

// define predicion bands
var predictionBands = myCollection.bandNames();

// set training classifier
var classifierTraining = TrainingImage.select(predictionBands).sampleRegions({collection: trainingFeatures, properties: ['class'], scale: 30 });

// set classifier
var classifier = ee.Classifier.svm()
                 .train({features:classifierTraining, classProperty:'class', inputProperties: predictionBands});

// classify
var classified = TrainingImage.select(predictionBands).classify(classifier);

// add the result to the Map

Map.addLayer(classified.clip(Ca), {min: 0, max: 5,
palette: ['f0ff00','616343','2f00ff','125610','a93e9f','b8fbc0']},'landuse classification')
Find the full example here
