
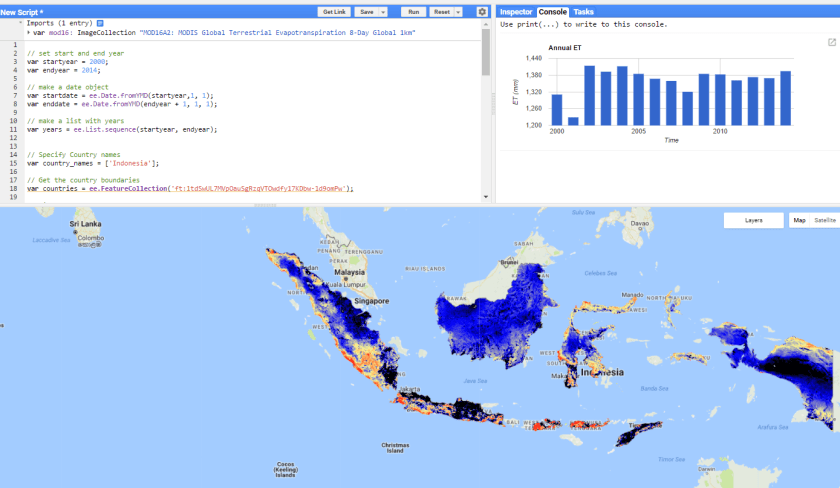
Use mod16 to investigate yearly variability in ET
Step 1: import the mod16 image collection
Step 2: Set the date variables
// set start and end year
var startyear = 2000;
var endyear = 2014;

// make a date object
var startdate = ee.Date.fromYMD(startyear, 1, 1);
var enddate = ee.Date.fromYMD(endyear + 1, 1, 1);

// make a list with years
var years = ee.List.sequence(startyear, endyear);
Step 3: Set the geographic location
// Specify Country names
var country_names = ['Indonesia'];

// Get the country boundaries
var countries = ee.FeatureCollection('ft:1tdSwUL7MVpOauSgRzqVTOwdfy17KDbw-1d9omPw');

// Filter for country
var Indonesia = countries.filter(ee.Filter.inList('Country', country_names));

// Get the geometry
var Indonesia = Indonesia.geometry();

// Get ET
var ET = mod16.select("ET")
Step 4: Calculate the yearly ET
var annualET = ee.ImageCollection.fromImages(
 years.map(function (year) {
 var annual = ET
 .filter(ee.Filter.calendarRange(year, year, 'year'))
 .sum()
 .multiply(0.1);
 return annual
 .set('year', year)
 .set('system:time_start', ee.Date.fromYMD(year, 1, 1));
}));
Step 5: Make a chart of the data
var title = {
 title: 'Annual ET',
 hAxis: {title: 'Time'},
 vAxis: {title: 'ET (mm)'},
};

var chart = ui.Chart.image.seriesByRegion({
 imageCollection: annualET,
 regions: Indonesia,
 reducer: ee.Reducer.mean(),
 band: 'ET',
 scale: 2500,
 xProperty: 'system:time_start',
 seriesProperty: 'SITE'
}).setOptions(title)
 .setChartType('ColumnChart');

 print(chart);
Step 6: Calculate the mean of the period
var annualMean = annualET.mean().clip(Indonesia);
Step 7: show the map
var ETViz = {
min: 1200,
max: 1800,
palette: '000000, 0000FF, FDFF92, FF2700, FF00E7'
};


Map.centerObject(Indonesia, 5);
Map.addLayer(annualMean,ETViz, 'mean yearly ET');
See an example here.
