

Calculate the volume height relation for existing or potential reservoirs.
In this exercise we are going to calculate the water level – volume curve of the Ban Ve dam.
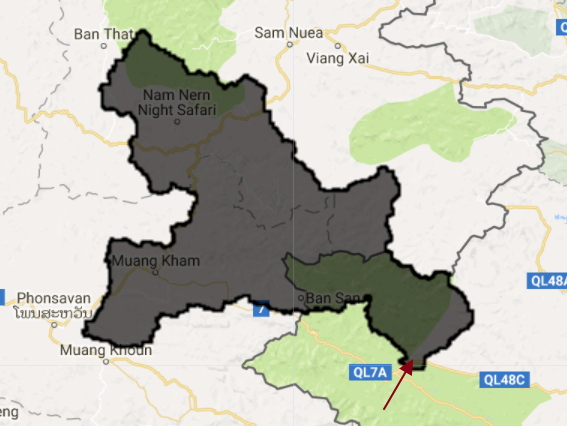
Step 1: import the upstream area:
// get the upstream area of the dam
var BanVEupstream = ee.FeatureCollection('ft:1z6zLTS1z5FlO1jizxY9g7k6-IIAcJvvT-5VxzVeL');
// add layer to map
Map.addLayer(BanVEupstream,undefined,"upstream area");
The dam is located at the red arrow
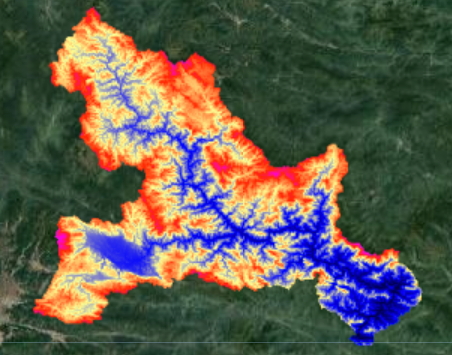
Step 2: Import the srtm and clip the basin
// import srtm data
var srtm = ee.Image("CGIAR/SRTM90_V4");
// clip ban ve area
var dem = srtm.clip(BanVEupstream);

var viz = {min:0, max:2000, palette:"000000,0000FF,FDFF92,FF2700,FF00E7"};
Map.addLayer(dem,viz,"elevation map");
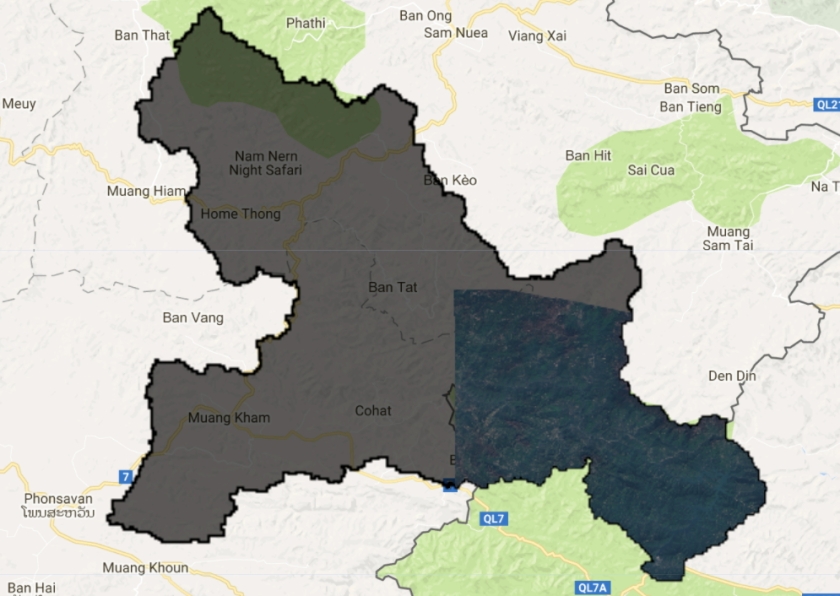
Step 3: Add a recent sentinel 2 image for visual interpretation
// add recent s2 rgb image of reservoir
var img = ee.Image("COPERNICUS/S2/20160209T034234_20160209T090731_T48QVG");
Map.addLayer(img.clip(BanVEupstream),{min:0,max:3000,bands:"B4,B3,B2"},"sentinel 2 image") ;
Step 4: Create a list with water levels
// set list with water levels
var waterlevel = ee.List.sequence(155,220,1);
Step 5: Copy paste the function below. This function calculates water depth for different water levels using the digital elevation model.
// Function to calculate the volume in the reservoir
var calcVolume = function(level,list){

 // calculate area inundated
 var inundated = srtm.clip(BanVEupstream).lte(ee.Number(level));

 // calculate water level in each pixel
 var water = inundated.multiply(dem).subtract(ee.Number(level)).multiply(-1)

 // calculate area
 var area = inundated.multiply(30).multiply(30);

 // calculate volume
 var volume = area.multiply(water);

 // sum the volume
 var totalvolume = volume.reduceRegion(ee.Reducer.sum(), BanVEupstream);

 // retunr result to list
 return ee.List(list).add(totalvolume.get('elevation'));
 };
Step 6: Apply the function above and put the values in an array
 // create emtpy list
var first = ee.List([]);

// iterate over water levels
var Volumes = ee.List(waterlevel.iterate(calcVolume, first));

 // set x an y values for list
var xValues = ee.Array(Volumes).divide(1000000000);
var yValues = ee.Array(waterlevel);
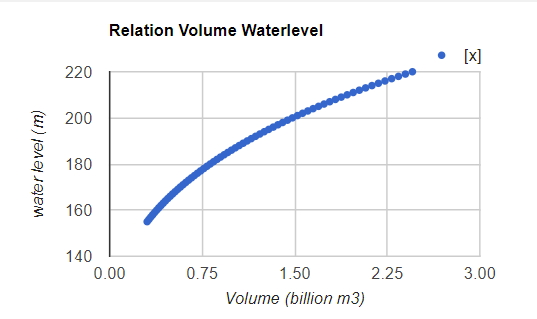
Step 7: Print the data as a chart.
//  Create the chart
var chart = ui.Chart.array.values(yValues, 0, xValues)
    .setOptions({
      title: 'Relation Volume Waterlevel',
      vAxis: {'title': 'water level (m)'},
      hAxis: {'title': 'Volume (billion m3)'},
      pointSize: 3,
});

// Print the chart.
print(chart)
Follow this link for the full code.

This is awesome!!!!!!
LikeLike
I have a query regarding this code:
// calculate area
var area = inundated.multiply(30).multiply(30);
I get confused. If we are using SRTM 90m resolution imagery, then shouldn’t the code be:
// calculate area
var area = inundated.multiply(90).multiply(90);
LikeLike
Excellent point. Use this one instead: USGS/SRTMGL1_003
LikeLiked by 1 person
Yep, makes sense!
I tried the SRTM version 3 30 m resolution dataset (“USGS/SRTMGL1_003”). Gives the same results as writing: var area = inundated.multiply(90).multiply(90);
LikeLike
About the calcVolume function, this particular line of code:
// calculate area
var area = inundated.multiply(30).multiply(30);
Since we are using SRTM 90m resolution imagery, shouldn’t the code be:
// calculate area
var area = inundated.multiply(90).multiply(90);
Please do let me know…
LikeLike
Thanks for code sharing. It is very applicable. Could you share its paper (as a reference), please?
Sincerely,
LikeLike