
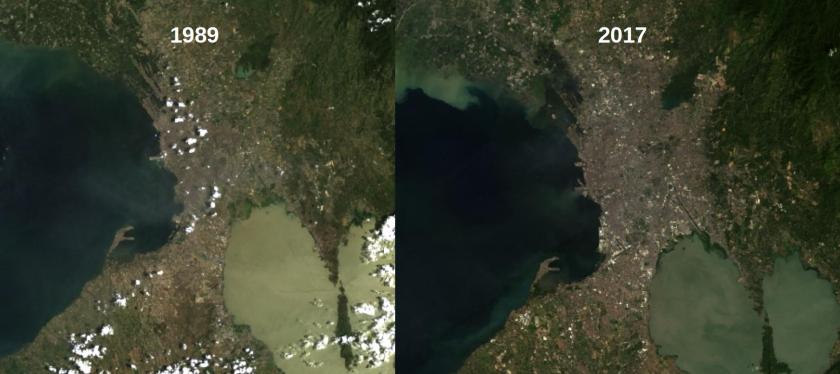
landsat 5 and 8 to investigate urban encroachment
Copy the text below and run the code
// import images
var img1997 = ee.Image("LANDSAT/LT05/C01/T1_SR/LT05_116050_19970515")
var img2010 = ee.Image("LANDSAT/LT05/C01/T1_SR/LT05_116050_20100706")
var img1989 = ee.Image("LANDSAT/LT05/C01/T1_SR/LT05_116050_19890407")
var img2016 = ee.Image("LANDSAT/LC08/C01/T1_SR/LC08_116050_20160213")

// display images
Map.addLayer(img1989,{bands:"B3,B2,B1",min:0,max:3000},"1989");
Map.addLayer(img1997,{bands:"B3,B2,B1",min:0,max:3000},"1997");
Map.addLayer(img2010,{bands:"B3,B2,B1",min:0,max:3000},"2010");
Map.addLayer(img2016,{bands:"B4,B3,B2",min:0,max:3000},"2016");
Question 1: What image is landsat 8?
Question 2: Why are different bands displayed?
