
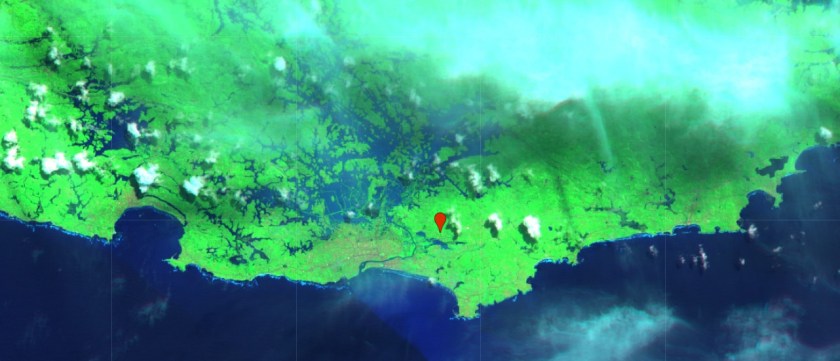
Flooding in 2017
step 1: import the images
// import data
var before = ee.Image("COPERNICUS/S2/20170207T050601_20170207T050557_T44NMM");
var after = ee.Image("COPERNICUS/S2/20170528T050611_20170528T050606_T44NMM");
step 2: display the images in swir1, nir and red
// display swir1, nir , red
Map.addLayer(before,{min:0,max:6000,bands:"??"},"before");
Map.addLayer(after,{min:0,max:6000,bands:"??"},"after"
step 3: calculate the ndwi
// calculate the ndwi
var waterBefore = before.normalizedDifference(["B3","B8"]);
var waterAfter  = after.normalizedDifference(["??","??"]);
step 4: show the water map
Map.addLayer(waterBefore,{min:-0.5,max:0.5},"water before");
Map.addLayer(waterAfter, {min: -0.5,max:0.5},"water after");
step 5: get the water and mask the land
// calculate the inundated area
var watermask = waterAfter.gt(??);
Map.addLayer(watermask.mask(watermask),{palette:"??"},"flooded");
