

spectral signature of different land use classes
step 1: copy the code below to display the sentinel-2 image
var bandsIn = ee.List(['B1','B2','B3','B4','B5','B6','B7','B8','B8A','B9','B10','B11','B12'])
var bandsOut = ee.List(['cb','blue','green','red','re1','re2','re3','nir1','nir2','waterVapor','cirrus','swir1','swir2'])
var wavelengths =[443.9,496.6,559,664.5,703.9,740.2,782.5,835.1,864.8,945,1373.5,1613.7,2202.4]
var img = ee.Image("COPERNICUS/S2/20171117T050101_20171117T051014_T44NMP").select(bandsIn,bandsOut)

Map.addLayer(img,{bands:"??,??,??",min:0,max:??})
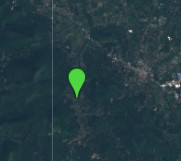
step 2: Add feature for agriculture

Step 3: Add a point to the map for agriculture
Step 4: Combine points into a feature collection
// Define and display a FeatureCollection of three known locations.
var points = ee.FeatureCollection([
agriculture,urban,water,forest
]);
step 5: Define the options for the chart.
// Define customization options.
var options = {
title: '?? ',
hAxis: {title: '??'},
vAxis: {title: '??'},
lineWidth: 1,
pointSize: 4,
series: {
0: {color: '50d643'},
1: {color: 'ff0404'},
2: {color: '0b4a8b'},
3: {color: '0e4c0c'},
}};
step 6: create and display the chart
// Create the chart and set options.
var spectraChart = ui.Chart.image.regions(
img, points, ee.Reducer.mean(), 30, 'label', wavelengths)
.setChartType('LineChart')
.setOptions(options);

print(spectraChart)

Would you please add its GEE link?
LikeLike