
Calculate monthly rainfall
Step 1: import the chirps data
Step 2: Set the date variables
// set start and end year
var startyear = ??;
var endyear = ??;

// make a date object
var startdate = ee.Date.fromYMD(startyear, 1, 1);
var enddate = ee.Date.fromYMD(endyear + 1, 1, 1);

// make a list with years
var years = ee.List.sequence(??, ??);
Step 3: Set the geographic location
// Specify Country names
var country_names = ['Sri Lanka'];

// Get the country boundaries
var countries = ee.FeatureCollection('ft:1tdSwUL7MVpOauSgRzqVTOwdfy17KDbw-1d9omPw');

// Filter for country
var SriLanka = countries.filter(ee.Filter.inList('Country', country_names));

// Get the geometry
var SriLanka = SriLanka.geometry();
Step 4:Calculate monthly precipitation
var monthlyPrecip =  ee.ImageCollection.fromImages(
  years.map(function (y) {
    return months.map(function(m) {
      var w = chirps.filter(ee.Filter.calendarRange(y, y, 'year'))
                    .filter(ee.Filter.calendarRange(m, m, 'month'))
                    .sum();
      return w.set('year', y)
              .set('month', m)
              .set('system:time_start', ee.Date.fromYMD(y, m, 1));

    });
  }).flatten()
);
Step 5: Calculate monthly precipitation
var meanMonthlyP =  ee.ImageCollection.fromImages(
  months.map(function (m) {
    var w = monthlyPrecip.filter(ee.Filter.eq('month', m)).??();
    return w.set('month', m)
            .set('system:time_start',ee.Date.fromYMD(1, m, 1));
  }).flatten()
);
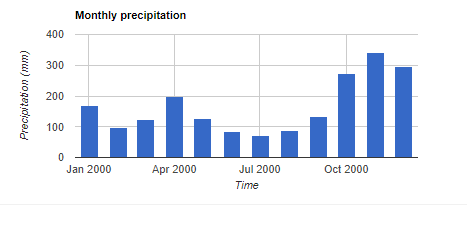
Step 6: Create and plot the chart
var title = {
  title: 'Monthly precipitation',
  hAxis: {title: 'Time'},
  vAxis: {title: 'Precipitation (mm)'},
};

var chartMonthly = ui.Chart.image.seriesByRegion({
  imageCollection: meanMonthlyP,
  regions: SriLanka,
  reducer: ee.Reducer.mean(),
  band: 'precipitation',
  scale: 2500,
  xProperty: 'system:time_start',
  seriesProperty: 'SITE'
}).setOptions(title)
  .setChartType('ColumnChart');

print(chartMonthly);
