
using landtrendr to determine standing age
LandTrendr (Landsat-based detection of Trends in Disturbance and Recovery) is an approach to extract spectral trajectories of land surface change from yearly Landsat time-series stacks (LTS) . The method brings together two themes in time-series analysis of LTS: capture of short-duration events and smoothing of long-term trends.
https://github.com/eMapR/LT-GEE
reference: Kennedy, R. E., Yang, Z., & Cohen, W. B. (2010). Detecting trends in forest disturbance and recovery using yearly Landsat time series: 1. LandTrendr—Temporal segmentation algorithms. Remote Sensing of Environment, 114(12), 2897-2910.
Step 1: get the collection and area of interest and time period.
// get annual collection
var annualSRcollection = ee.ImageCollection("projects/servir-mekong/yearlyComposites").filterDate(ee.Date.fromYMD(startYear,1,1),ee.Date.fromYMD(endYear,1,1))

// set the area of interest
var aoi = ee.FeatureCollection("users/servirmekong/Vietnam/CHL_Boundary").geometry();

var startYear = 1990
var endYear = 2017
Step 2: add the function to calculate the nbr
// define function to calculate a spectral index to segment with LT
var nbr = function(img) {

    var index = img.normalizedDifference(['nir', 'swir1'])
                   .select([0], ['NBR'])
                   .multiply(1000)
                   .set('system:time_start', img.get('system:time_start'));
    return img.addBands(index) ;
}
Step 3:set the relevant parameters
var distDir = -1;

var run_params = {
  maxSegments:            6,
  spikeThreshold:         0.9,
  vertexCountOvershoot:   3,
  preventOneYearRecovery: true,
  recoveryThreshold:      0.25,
  pvalThreshold:          0.05,
  bestModelProportion:    0.75,
  minObservationsNeeded:  6
};
Step 4: add the function for your disturbance image
var getLandTrendrDisturbanceImage = function (startYear, endYear, lt) {

  var lt = lt.select('LandTrendr');

  var vertexImage = lt.arraySlice(0, 3, 4); // get the vertex - yes(1)/no(0) dimension, gives 1 dimension - 0 axis and y dimensions - 1 axis
  //_image = _image.updateMask(_image.arrayLength(1).eq(years.length));
  // extract the segmentation-fitted index stack as
  var years = [];
  for (var i = startYear; i <= endYear; ++i) {
    years.push('year_' + i.toString());
  }
  vertexImage = vertexImage.updateMask(vertexImage.arrayLength(1).eq(years.length));
  vertexImage = vertexImage.arrayProject([1]).arrayFlatten([years]);
  var images = [];
  for (var j = startYear; j <= endYear; ++j) {
    var name = 'year_' + j.toString();
    var _image = vertexImage.select([name], ['vertex']).int8().set('system:time_start', ee.Date.fromYMD(j, 1, 1).millis());
    images.push(_image);
  }
  var imageCollection = ee.ImageCollection.fromImages(images);

  // This is a function to pass to Iterate().
  // As images are computed and added to the list.
  var accumulate = function(image, list) {

    //image = image.where(image.eq(1), 0).int8();
    // 1 is vertex
    var myimg = image.not().int8();

    // get(-1) the last image in the image collection
    var previous = ee.Image(ee.List(list).get(-1)).int8();

    var added = previous.add(myimg).set('system:time_start', image.get('system:time_start'));
    added = added.where(image.eq(1), 0);
    // Return the list
    return ee.List(list).add(added.int8());
  };

  // The first  image in the list is just 1
  var newList = ee.List([ee.Image(0).int8().set('system:time_start', imageCollection.first().get('system:time_start')).select([0], ['vertex'])]);
  // Create an ImageCollection of cumulative anomaly images by iterating.
  var cumulative =  ee.List(imageCollection.iterate(accumulate, newList));
  cumulative = ee.ImageCollection(cumulative.remove(cumulative.get(0)));

  return cumulative;

};
Step 5: apply the function
var ltCollection = annualSRcollection.map(nbr)
ltCollection = ltCollection.map(function(img) {return img.select("NBR").multiply(distDir)
.set('system:time_start', img.get('system:time_start'))});
//----- RUN LANDTRENDR -----
run_params.timeSeries = ltCollection;
var lt = ee.Algorithms.TemporalSegmentation.LandTrendr(run_params);
var dist = getLandTrendrDisturbanceImage(startYear+1,endYear,lt)
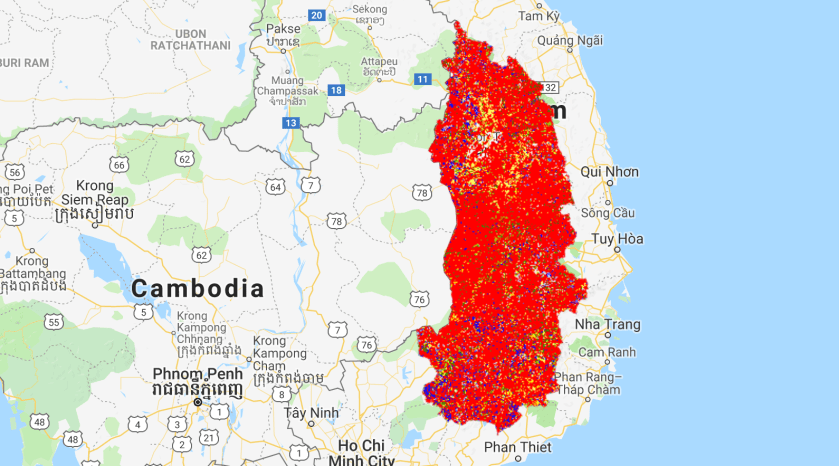
var img2005 = ee.Image(dist.filterDate("2005-01-01","2005-12-31").first()).clip(aoi)
var img2015 = ee.Image(dist.filterDate("2015-01-01","2015-12-31").first()).clip(aoi)
Map.addLayer(img2005,{min:0,max:10,palette:"blue,white,yellow,green,red"},"standing age 2005")
Map.addLayer(img2015,{min:0,max:10,palette:"blue,white,yellow,green,red"},"standing age 2015")
Step 7: define disturbance mapping filter parameters
// define disturbance mapping filter parameters
 // delta filter for 1 year duration disturbance, <= will not be included as disturbance - units are in units of segIndex defined in the following function definition
var treeLoss1  = 175;
// delta filter for 20 year duration disturbance, <= will not be included as disturbance - units are in units of segIndex defined in the following function definition
var treeLoss20 = 200;
// pre-disturbance value threshold - values below the provided threshold will exclude disturbance for those pixels - units are in units of segIndex defined in the following function definition
var preVal     = 400;
 // minimum mapping unit for disturbance patches - units of pixels
var mmu        = 15;

// assemble the disturbance extraction parameters
var distParams = {
  tree_loss1: treeLoss1,
  tree_loss20: treeLoss20,
  pre_val: preVal
};
Step 7: add function to extract greatest disturbance based on spectral delta between vertices.
// ----- function to extract greatest disturbance based on spectral delta between vertices
var extractDisturbance = function(lt, distDir, params, mmu) {
// select only the vertices that represents a change
var vertexMask = lt.arraySlice(0, 3, 4);
var vertices = lt.arrayMask(vertexMask);

// construct segment start and end point years and index values
var left = vertices.arraySlice(1, 0, -1);
var right = vertices.arraySlice(1, 1, null);
var startYear = left.arraySlice(0, 0, 1);
var startVal = left.arraySlice(0, 2, 3);
var endYear = right.arraySlice(0, 0, 1);
var endVal = right.arraySlice(0, 2, 3);

var dur = endYear.subtract(startYear);
var mag = endVal.subtract(startVal);

// concatenate segment start year, delta, duration, and starting spectral index value to an array
var distImg = ee.Image.cat([startYear.add(1), mag, dur, startVal.multiply(distDir)]).toArray(0);

// sort the segments in the disturbance attribute image delta by spectral index change delta
var distImgSorted = distImg.arraySort(mag.multiply(-1));

// slice out the first (greatest) delta
var tempDistImg = distImgSorted.arraySlice(1, 0, 1).unmask(ee.Image(ee.Array([[0],[0],[0],[0]])));

// make an image from the array of attributes for the greatest disturbance
var finalDistImg = ee.Image.cat(tempDistImg.arraySlice(0,0,1).arrayProject([1]).arrayFlatten([['yod']]),
tempDistImg.arraySlice(0,1,2).arrayProject([1]).arrayFlatten([['mag']]),
tempDistImg.arraySlice(0,2,3).arrayProject([1]).arrayFlatten([['dur']]),
tempDistImg.arraySlice(0,3,4).arrayProject([1]).arrayFlatten([['preval']]));

// filter out disturbances based on user settings
var threshold = ee.Image(finalDistImg.select(['dur']))
.multiply((params.tree_loss20 - params.tree_loss1) / 19.0)
.add(params.tree_loss1)
.lte(finalDistImg.select(['mag']))
.and(finalDistImg.select(['mag']).gt(0))
.and(finalDistImg.select(['preval']).gt(params.pre_val));

// apply the filter mask
finalDistImg = finalDistImg.mask(threshold).int16();

// patchify the remaining disturbance pixels using a minimum mapping unit
if(mmu > 1){
var mmuPatches = finalDistImg.select(['yod'])
.connectedPixelCount(mmu, true)
.gte(mmu);
finalDistImg = finalDistImg.updateMask(mmuPatches);
}

return finalDistImg;
};
Step 8: Run the extraction function
// run the dist extract function
var distImg = extractDisturbance(lt.select('LandTrendr'), distDir, distParams);
Step 8: add the map and legend
Map.addLayer(distImg.select(['yod']).clip(chl), viz, 'Year of Detection');    // add disturbance year of detection to map

// set position of panel
var legend = ui.Panel({
style: {
position: 'bottom-left',
padding: '8px 15px'
}
});

// Create legend title
var legendTitle = ui.Label({
value: 'Year',
style: {
fontWeight: 'bold',
fontSize: '18px',
margin: '0 0 4px 0',
padding: '0'
}
});

// Add the title to the panel
legend.add(legendTitle);

// create the legend image
var lon = ee.Image.pixelLonLat().select('latitude');
var gradient = lon.multiply((viz.max-viz.min)/100.0).add(viz.min);
var legendImage = gradient.visualize(viz);

// create text on top of legend
var panel = ui.Panel({
widgets: [
ui.Label(viz['max'])
],
});

legend.add(panel);

// create thumbnail from the image
var thumbnail = ui.Thumbnail({
image: legendImage,
params: {bbox:'0,0,10,100', dimensions:'10x200'},
style: {padding: '1px', position: 'bottom-center'}
});

// add the thumbnail to the legend
legend.add(thumbnail);

// create text on top of legend
var panel = ui.Panel({
widgets: [
ui.Label(viz['min'])
],
});

legend.add(panel);

Map.add(legend);
