
using tree canopy cover
Question 1
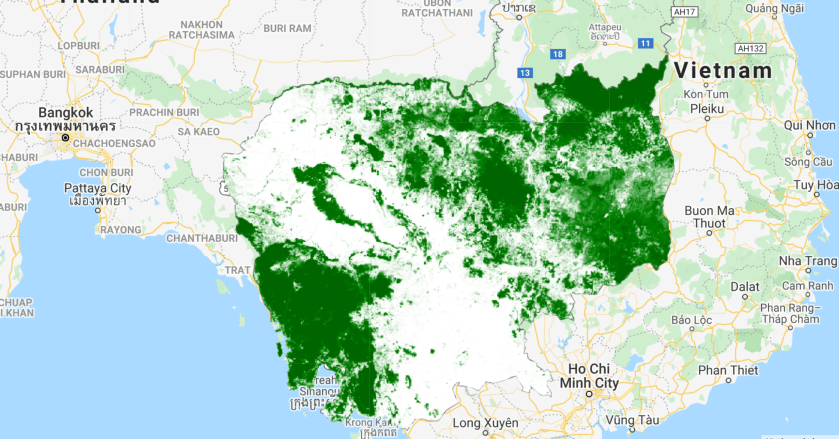
here we import a dateset on tree canopy cover and calculate forest using a 10% tree cover threshold
// import feature collection with country boundaries
var countries = ee.FeatureCollection("USDOS/LSIB_SIMPLE/2017");
// select Cambodia
var kh = countries.filter(ee.Filter.eq("country_na","Cambodia")).geometry();

// import tree canopy cover data
var tcc2000 = ee.Image("projects/servir-mekong/UMD/tree_canopy/tcc_2000").clip(kh);
var tcc2020 = ee.Image("projects/servir-mekong/UMD/tree_canopy/tcc_2020").clip(kh);

// use 10% as a threshold for forest
var forest2000  = tcc2000.gt(10);
var forest2020  = tcc2020.gt(10);

// add tcc to the map
Map.addLayer(tcc2000,{min:0,max:100,palette:"white,green,darkgreen"},"tree canopy cover 2000");
Map.addLayer(tcc2020,{min:0,max:100,palette:"white,green,darkgreen"},"tree canopy cover 2020");

// add forest layer to the map
Map.addLayer(forest2000,{min:0,max:1,palette:"white,darkgreen"},"Forest 2000");
Map.addLayer(forest2020,{min:0,max:1,palette:"white,darkgreen"},"Forest 2020");
Question 2
we calculate forest loss now between the years 2020 and 2000. copy the lines below in the existing code
var forestLoss = forest2000.and(forest2020.eq(0))
Map.addLayer(forestLoss,{min:0,max:1,palette:"white,red"},"forest loss");
Question 3
we calculate the pixel area in 2000. copy the lines below to your existing code
var areaImage = forest2000.rename("forest").multiply(ee.Image.pixelArea());

// Sum the values of forest in 2000
var stats = areaImage.reduceRegion({
  reducer: ee.Reducer.sum(),
  geometry: kh,
  scale: 30,
  maxPixels: 1e9
});


print('pixel area in 2000 ', stats.get('forest'), 'square meters');
Question 4
we do the same for the year 2020
var areaImage = forest2020.rename("forest").multiply(ee.Image.pixelArea());

// Sum the values of forest in 2020
var stats = areaImage.reduceRegion({
  reducer: ee.Reducer.sum(),
  geometry: kh,
  scale: 30,
  maxPixels: 1e9
});


print('pixel area in 2020 ', stats.get('forest'), 'square meters');
Question 5
now we calculate the forest loss for the period 2000 until 2020
var areaImage = forestLoss.rename("loss").multiply(ee.Image.pixelArea());
// Sum the values of forest loss pixels
var stats = areaImage.reduceRegion({
  reducer: ee.Reducer.sum(),
  geometry: kh,
  scale: 30,
  maxPixels: 1e9
});

print('pixels representing loss: ', stats.get('loss'), 'square meters');
Question 6
now we calculate the forest loss per province. Copy the code below to your existing script and hit run.
// define the countries of interest
var cambodia = ee.FeatureCollection("projects/servir-mekong/admin/KHM_adm1")

var chart =
    ui.Chart.image.byRegion
        ({
          image:areaImage.divide(10000),
          regions: cambodia,
          reducer: ee.Reducer.sum(),
          scale: 100,
          xProperty: 'NAME_1'
        })
        .setSeriesNames(['loss area'])
        .setChartType('ColumnChart')
        .setOptions({
          title: 'forest loss',
          hAxis: {title: 'Date', titleTextStyle: {italic: false, bold: true}},
          vAxis: {
            title: 'area loss (ha)',
            titleTextStyle: {italic: false, bold: true}
          },
          lineWidth: 5,
          colors: ['red'],
          curveType: 'function'
        });

print(chart);

Thank you for this great contribution!
A question: when in question 6 you use the code: ” xProperty: ‘NAME_1’ “. What variable in your boundaries dataset are you referring with “NAME_1” or what is it implying?
Thank you again for this great help! 🙂
LikeLike