
Display satellite images on top of google maps
This introductory training is part of the official training materials prepared by the United States Department of Agriculture.
Google Earth Engine is available via a web-based JavaScript Application Program Interface (API) called the Code Editor. This platform is where users can write and execute scripts to share and repeat geospatial analysis and processing workflows. The Code Editor offers access to the full power of Earth Engine. In this exercise, we will begin learning about the Code Editor platform and explore some basic programming concepts, in JavaScript. Learning of fundamentals of coding and JavaScript is required to use Earth Engine.
Working with Images
Open a new script
1. Open the Code Editor webpage in Google Chrome, if it is not already open: https://code.earthengine.google.com/
2. Click on the dropdown arrow adjacent to the Reset button and select Clear script.
Create a variable representing a single Landsat 8 image
1. Use the code in the box below to create a variable representing an ee.Image object for a
2014 Landsat 8 image. Copy and paste the code below into the Code Editor Code Editor.
// Get the image.
var LC8_image = ee.Image('LANDSAT/LC8_L1T_TOA/LC81290502015036LGN00');
Notes about JavaScript syntax: There’s a lot going on in just two lines. Take a closer look at the pieces of this statement we’re loading into GEE (note, refer to the Appendices to learn more about JavaScript syntax and some basic programming concepts).
1) Double forward slashes, //, are comment characters in JavaScript. These prevent text on that line from executing. These are useful for creating notes in your code.
2) Variables are declared in JavaScript using the keyword var. Variables can be numbers, strings, objects, object collections, etc. Variables are used to store information for use later on in the script. In the case of the statement above, you are naming the variable LC8_image and using it to refer to the raster dataset
you are interested in analyzing.
3) ee.Image() is a GEE function that tells GEE that you want to load an image as an object (and in this case, save it as a variable called ‘LC8_image’). In JavaScript, functions start with a letter and have a pair of parentheses at the end. Functions often include inputs or parameters, which tell the function what to do, and are specified inside of the parentheses. In this case, the parameter you are specifying inside the parenthesis is the image ID. A generalized version of the statement above is: ee.Image(‘image_id’). The ‘image_id’ is the image that you would like to load (‘LANDSAT/LC8_L1T_TOA/LC81290502015036LGN00’) and set as the variable
(LC8_image).
4) The syntax for specifying the image ID in this function (ee.Image) is to surround the string of characters (the image ID, ‘LANDSAT/LC8_L1T_TOA/LC81290502015036LGN00’) in quotes. The image id is in quotes because the collection and image name together is a string. Strings are sets of characters that
in this example, name the specific dataset.
a. Landsat image ids for individual Landsat scenes can be found at glovis.usgs.gov. You will work with this more in Exercise 3.
5) JavaScript statements end with a semicolon.
2. Run the code and observe the result.
Click the Run button and note that nothing happens in the map or the console. This code merely creates the variable, nothing is printed or displayed.
Add the image to the Code Editor map
1. Copy and paste, or type, the code below into your script. These additional lines will add the Landsat image to the map panel. Add these lines below the code from the previous step. GEE will execute the code (lines) sequentially when you hit Run.
//Add the image to the map.
Map.addLayer(LC8_image);
2. Run the code and review the result.
Click on the Run button. This time an image will load in the Map Output window. If you are not zoomed into the USA, centered on Utah, you won’t see anything.
Use your cursor to navigate (left click and drag) in the map view to Utah and find the image you called. It would be nice if the script did this for us, next you will add that statement into your script.
Center and Zoom the map window
Next you will add a statement to set the zoom factor and location on which to center the map output window. The Map.centerObject() is a function that tells GEE where to position the map output window.
1. Copy and paste the two lines of code (below) underneath the four lines you already have in the GEE code editor window. Click Run.
//center map on the tile
Map.centerObject(LC8_image, 8);
2. To zoom out, decrease the second input to a number less than 8. To zoom in more, increase the second input parameter (try 10). Modify your statement so it looks like the two lines below and click Run. What happened?
3. In the panel in the upper left, switch from the Scripts to the Docs tab. Type
Map.centerObject() into the Docs search bar. What is the range of the zoom parameter?
//center map on the tile
Map.centerObject(LC8_image, 10);
Explore the map window tools
1. Explore this image, the LC8_image (‘LANDSAT/LC8_L1T_TOA/LC81290502015036LGN00’), with the Code Editor map viewer tools.
You can zoom and pan using the tools on the left of the map output panel (shown in the following graphic).

Use the Layers tool (on the right of the map output panel) to turn the image (Layer 1) on or off (shown in following image).

Swipe the transparency lever (the sliding bar to the right of the layer name in the
preceding image). This will make the ‘Layer 1’ transparent, revealing the base map
underneath.
Explore the Inspector window
1. Click on the Inspector Tab in the upper right hand corner of the Earth Engine Code Editor interface. Your cursor will now change to a cross hairs when you place it in the map window.
2. Now click anywhere on the map using the Inspector, the cross hairs, to identify pixel values for each band in your image at the selected location (refer to following graphic for example output).

Change visualization parameters to improve the display
Now you can see the image, however the color parameters are not very well suited to this image. You will change the visualization parameters next.
1. Open the documentation for addLayer function in the Map group by clicking on the Docs tab in the left panel in the Code Editor.
Expand the Map group and select Map.addLayer from the list (as illustrated below); or Search for Map.addLayer in the Filter methods… search bar.
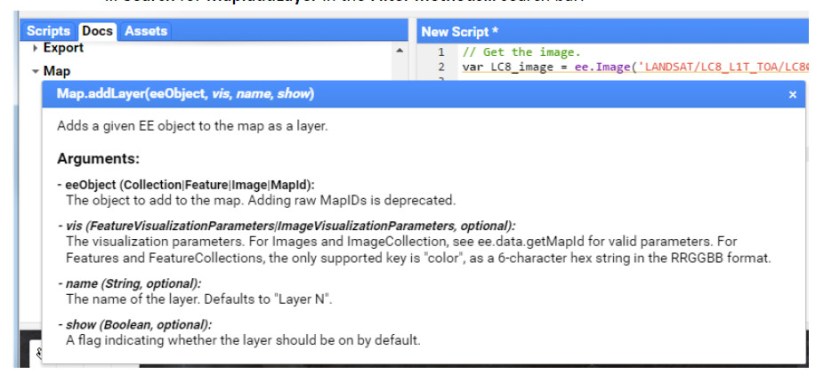
2. Review the documentation that appears (shown above). This provides information about the use and arguments for this function.
Notice that some input options (such as vis) are italicized in the documentation. This means that these are optional parameters that can be specified or left out of the Map.addLayer statement. If you want to skip an optional parameter use “undefined” as a place holder. See the statement below for an example.
Map.addLayer(LC8_image,undefined, 'Landsat8scene');

There are a number of options to include to adjust how images are displayed. The information in the parenthesis following each option indicates how to format the information – e.g., which data type is required (a number, strings, array, etc).
The inputs that are most commonly used to modify display settings include the following:
Bands: allows the user to specify which bands to render as red, green, and blue.
Min and max: sets the stretch range of the color gun. The range is dependent on the data type. For example unsigned 16-bit imagery has a total range of 0 to 65,536. This option lets you set the display to a subset of that range.
Palette: specifies the color palette used to display information. You will see how to use this option later in the tutorial.
Naming convention (in the Layers Legend): you can specify the name that appears in the layers legend here as well. We have named this layer ‘Landsat8scene’ in the code below.
Syntax: Most of these optional parameters are entered as a keys-value pair in a dictionary object. The syntax is:
{vis_param1: number, number, number
vis_param2: ‘string, string, string’,
// or an array of strings like this:
vis_param2: [‘string’, ‘string’, ‘string’]}
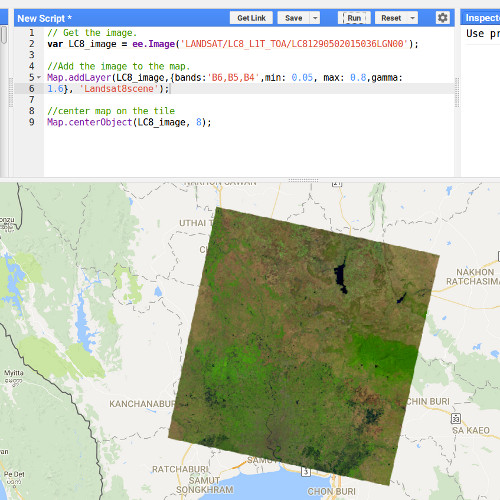
1. Modify the Map.addLayer() function to display the image as a false color composite and apply a stretch to improve the display. Modify the Map.addLayer() statement from the previous steps to look like the code below. The statement below includes the optional parameters for which bands to display (band 6, 5, and 4), specifies a stretch to improve the visualization, and finally gives the image a display name.
2. Click Run and use the map tools to explore the result. Note that the name under the Layers (legend) is now Landsat8scene.
Map.addLayer(LC8_image,{bands:'B6,B5,B4',min: 0.05, max: 0.8,gamma:
1.6}, 'Landsat8scene');
3. You can also specify the bands as strings in an array. Look at the statement below, it will do the same thing as the statement above. Do you notice the difference in syntax, it’s rather subtle?
// Add the image to map as a false color composite.
Map.addLayer(LC8_image,{bands:['B6', 'B5', 'B4'],min: 0.05, max:
0.8,gamma: 1.6}, 'Landsat8scene');
4. Copy and paste the following statement in your code editor. Then click Run.
print(LC8_image);
5. Now in the Console tab, click on the arrow next to Image LANDSAT/… to display the image properties. Then click on the arrow next to bands: to display the band properties. This will reveal the first band (indexed at 0) is called “B1”, the second (indexed at 1) is called “B2”, etc. Refer to following graphic for an example (note: the numbers in the image will not align perfectly, since this picture represents a scene from the USA).
6. Click the Save button in the upper right of the Code Editor panel to save your example script for future reference.
Name this script Visualize a Landsat 8 image.

Hello,
Thanks for your topic.
in your explanations you spoke about the number of bit (16bits) what makes it possible to choose from 0 to 96000 thus in an 8 bits image 0 to 255. I do not understand the min = 0.05 and max = 0.8.
I have one question: How can I get the value of min and max in visualization’s Parameter. ?
LikeLike