Run an example script and review the results
This introductory training is part of the official training materials prepared by the United States Department of Agriculture.
Google Earth Engine is available via a web-based JavaScript Application Program Interface (API) called the Code Editor. This platform is where users can write and execute scripts to share and repeat geospatial analysis and processing workflows. The Code Editor offers access to the full power of Earth Engine. In this exercise, we will begin learning about the Code Editor platform and explore some basic programming concepts, in JavaScript. Learning of fundamentals of coding and JavaScript is required to use Earth Engine.
Run an example script and review the results
1. Click on the Scripts tab in the left-hand panel and expand the Examples group.
2. Scroll down until you see the Image group. Click on the triangle to expand this group if
necessary.

3. Select the Normalized Difference script from the list of example scripts (stored within the Image grouping). It will copy the script into your Code Editor panel.
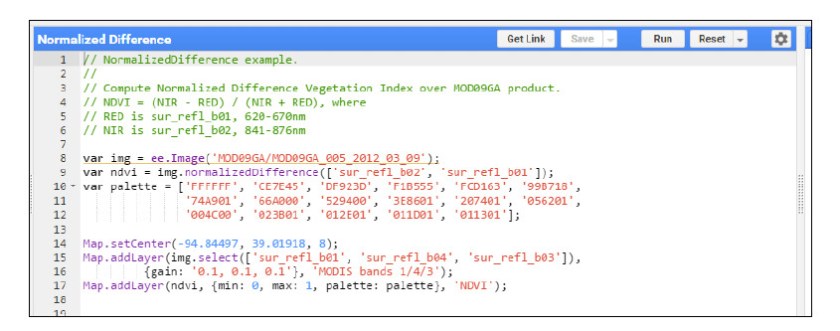
4. The graphic below shows the script that should appear in the Code Editor panel (upper center panel).
What is a script?
A script is a series of instructions that a computer follows to execute some process. It is like a recipe – a set of instructions that a cook follows one by one to create a dish. In the Code Editor platform that we are working in, the instructions are written as JavaScript statements. The computer follows these statements step-by-step. As scripts get more complicated, a better analogy is perhaps comparing the script to an employee handbook or a car manual. There is a lot of information in there – but only a portion of it needs to be followed at any point in time. For example, if an employee wanted to know what to do if a fire alarm was going off – they certainly shouldn’t be reading the book from cover to cover. Scripts can be designed just like handbooks and car manuals – to help a reader locate and act on specific pieces of information. In the case of scripts, the reader is the computer, not the employee. And instead of tables of contents and indices within books, the script design elements include things such as conditional statements.
5. Read the Normalized Difference script, line by line (or statement by statement), to see what it is doing:
Lines 1 to 6 are notes, or comments, the creator included to describe the script. Line comments are designated with the //, the double slashes at the beginning of the line. Comments are ignored by the Code Editor when the script executes.
Line 8 accomplishes two things. It declares a variable, called img. It then assigns a value to this variable. The value is a MODIS image
ee.Image(‘MOD09GA/MOD09GA_005_2012_03_09’).
Line 9 does several things. It declares and assigns a value to a variable, called ndvi. It also calls the Earth Engine NormalizedDifference method and applies it to the variable “img” defined in the previous line. The bands “sur_refl_b02” and “sur_refl_b01” are specified as inputs/arguments to that calculation. These two bands are the NIR and Red MODIS bands, so the result of the calculation is a Normalized Difference Vegetation Index (NDVI) image. This calculated NDVI image is what is being assigned to the ndvi variable.

Lines 10-12 declare a variable, palette, and assign to it an array that specifies a palette of
hexadecimal color codes for displaying the resulting NDVI image. The hexadecimal colors
range from white (FFFFFF) to browns (e.g., CE7E45) to yellows (e.g., FCD163) to greens
(e.g., 529400) to very dark (011301).
Tip! You can read more about hexadecimal color codes here http://www.colorhexa.com/.
Line 14 centers the map to the area of interest. The parameters, the values inside the
brackets, are the longitude and latitude values for Kansas City, USA; the third value sets
the zoom level.
Lines 15-17 add data to the map output window (lower panel). Two images are added –
the img variable, which points to the original MODIS image, and the ndvi variable, which
points to the normalized difference image we created in line 9. We’ll discuss the addLayer
parameter settings a bit later in the day.

6. Click the Run button in the upper-right of the code editor to run the Normalized Difference script.
You should see a MODIS image and the resulting NDVI image appear in the map output
window at the bottom of your screen.
7. Visually examine the results in the map output window using the map viewer tools.
Click or mouse-hover on the Layers button in the upper right hand corner of the Map
output panel at the bottom of your screen (shown in the following graphic).
Toggle the NDVI layer on and off by unchecking and checking the box next to the NDVI
Layer.
Click and drag the slider-bar back and forth to adjust the transparency of the NDVI layer
in order to view the MODIS image beneath the NDVI image (see following image, with
visualization parameter box).

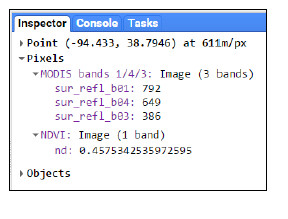
8. Use the Inspector Panel to explore the values in the resulting NDVI image.
Click on the Inspector tab in the upper right-hand panel.
(a) Hover your cursor over the map. Notice that your cursor has become a cross.

Click anywhere on the map and observe the values that appear in the window under the
Inspector tab.
These are the pixel values at this location for:
– The individual MODIS band values for the displayed bands appear under the MODIS image name.
– The computed NDVI values.