

A landuse map from the complete Landsat archive
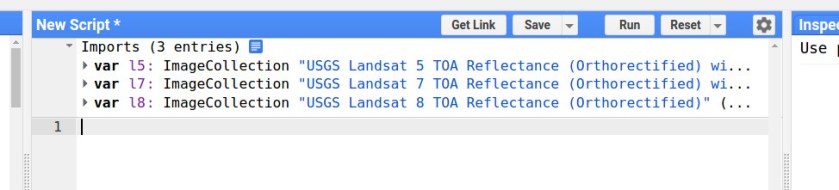
1. import the Landsat 5, 7 and 8 ImageCollections.
2. Set the time range.
// Define time range
var startyear = 2006;
var endyear = 2016;

// Set date in ee date format
var startdate = ee.Date.fromYMD(startyear,1,1);
var enddate = ee.Date.fromYMD(endyear,12,31)
3. Import a fusion table of your study area.
// The Ca basin
var Ca = ee.FeatureCollection('ft:1ILFPzWUf4dL_tKNY0Rd3EhGtRQoLfzmk_00i9xC3');
4. Filter the ImageCollections based on date and area.
// filter on date and bounds
var l5images = l5.filterDate(startdate,enddate).filterBounds( Ca);
var l7images = l7.filterDate(startdate,enddate).filterBounds( Ca);
var l8images = l8.filterDate(startdate,enddate).filterBounds( Ca);
5. Include a function to remove the clouds
// set cloud threshold
var cloud_thresh = 40;

// Functions
var cloudfunction = function(image){
  //use add the cloud likelihood band to the image
  var CloudScore = ee.Algorithms.Landsat.simpleCloudScore(image);
  //isolate the cloud likelihood band
  var quality = CloudScore.select('cloud');
  //get pixels above the threshold
  var cloud01 = quality.gt(cloud_thresh);
  //create a mask from high likelihood pixels
  var cloudmask = image.mask().and(cloud01.not());
  //mask those pixels from the image
  return image.updateMask(cloudmask);
};
6. Run the cloud function on all images in the image collection.
// mask all clouds in the image collection
l5images = l5images.map(cloudfunction);
l7images = l7images.map(cloudfunction);
l8images = l8images.map(cloudfunction);
7. Select the red and NIR bands.
// Select the red and NIR bands
l5images = l5images.select(["B4","B3"]);
l7images = l7images.select(["B4","B3"]);
l8images = l8images.select(["B5","B4"]);
8. Calculate the NDVI for all images.
// calculate ndvi from landsat 8
function l8ndvi(img) {
  var ndvi = img.normalizedDifference(['B5', 'B4']).rename('NDVI');
  return img.addBands(ndvi);
}

// calculate ndvi from landsat 5 & 7
function l57ndvi(img) {
  var ndvi = img.normalizedDifference(['B4', 'B3']).rename('NDVI');
  return img.addBands(ndvi);
}

// calculate ndwi for each image in imagecollection
var l5ndvi = l5images.map(l57ndvi);
var l7ndvi = l7images.map(l57ndvi);
var l8ndvi = l8images.map(l8ndvi);
9. Combine all images into a single image collection.
// combine all data in single image collection
var allcollection =  ee.ImageCollection((l5ndvi.merge(l7ndvi)).merge(l8ndvi));
10. Calculate the mean NDVI for each month.
// create list for years
var months = ee.List.sequence(1,12);

// calculate the ndvi for each month
var monthlyNDVI =  ee.ImageCollection.fromImages(
  months.map(function(m){
  var w = allcollection.select("NDVI").filter(ee.Filter.calendarRange(m, m, 'month'))
           .mean();
  return w.set('year', 2000)
           .set('month', m)
           .set('date', ee.Date.fromYMD(2000,m,1))
           .set('system:time_start',ee.Date.fromYMD(2000,m,1))

}).flatten());
11. show the mean NDVI of the image collection
// the vizualization settings
var ndvi_viz = {min:0.0, max:0.70, palette:"ffe60a,dfffd1,277005"};

// add map to canvas
Map.addLayer(monthlyNDVI.select("NDVI").mean().clip(Ca),ndvi_viz ,"ndvi")
Find an example here.
Now we are going to plot the temporal signature
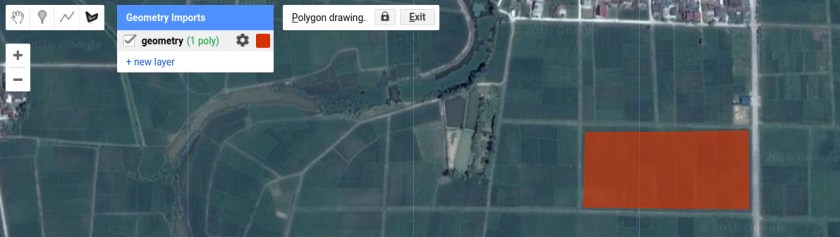
12. Select the polygon drawing tool.

13. Draw a polygon on the landuse class of interest.
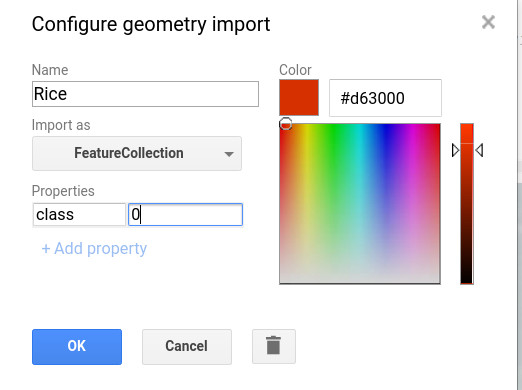
14. Specify the name, select Feature collection and give it the property class with number 0.
15. Repeat this procedure for other classes by adding a new layer. Make sure you give the classes different numbers.
16. Merge the different classes into one featurecollection
// merge into one feature collection
var mergedtable = rice //0
.merge(urban)               //1
.merge(water)               //2
.merge(richforest)          //3
.merge(annualcrops)         //4
.merge(secondaryforest)     //5
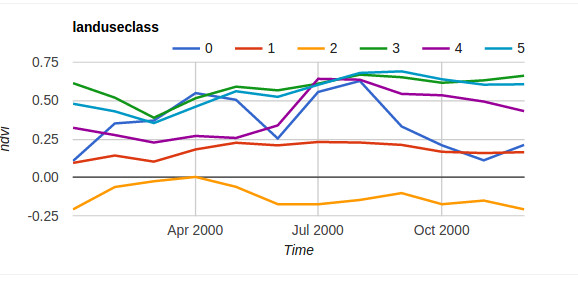
17. Display the temporal signature as a chart
// Predefine the chart titles.
var title = {
  title: 'landuseclass',
  hAxis: {title: 'Time'},
  vAxis: {title: 'ndvi'},
};

// create chart
var chart = ui.Chart.image.seriesByRegion(monthlyNDVI,
                                          mergedtable,
                                           ee.Reducer.mean(),
                                           'NDVI',
                                           30,
                                           'system:time_start',
                                           'class').setOptions(title);

print(chart);
Now we need to add the 12 images (1 for each month) as bands to a new image collection. This can be done by the code below.
18. Copy and paste the code below into your code editor
// Create a list with months
var monthnames = ["jan","feb","mar","apr","may","jun","jul","aug","sep","oct","nov","dec"]

// make a list of from the imagecollection
var myNDVIlist = monthlyNDVI.select("NDVI").toList(12);

// create a new image from the month January
var myCollection = ee.Image(myNDVIlist.get(0)).rename("jan");

// add the image of each month as band to the image
for (var i = 1; i < myNDVIlist.length().getInfo(); i++) {
  var mymap = ee.Image(myNDVIlist.get(i)).rename(monthnames[i]);
  myCollection = myCollection.addBands(mymap);
}
19. Use the code below to classify the image.
// set training image collection
var TrainingImage = myCollection;

// define training features
var trainingFeatures = mergedtable;

// define predicion bands
var predictionBands = myCollection.bandNames();

// set training classifier
var classifierTraining = TrainingImage.select(predictionBands).sampleRegions({collection: trainingFeatures, properties: ['class'], scale: 30 });

// set classifier
var classifier = ee.Classifier.svm()
                 .train({features:classifierTraining, classProperty:'class', inputProperties: predictionBands});

// classify
var classified = TrainingImage.select(predictionBands).classify(classifier);

// add the result to the Map

Map.addLayer(classified.clip(Ca), {min: 0, max: 5,
palette: ['f0ff00','616343','2f00ff','125610','a93e9f','b8fbc0']},'landuse classification')
Find the full example here

Why do I have this error?
ndvi: Layer error: reduce.mean: Error in map(ID=LT05_136030_20020813):
Landsat.simpleCloudScore: Image is not a Landsat scene or is missing SENSOR_ID metadata.
Thanks for your reply!
LikeLike
I think you used the surface reflectance dataset when replacing the old image collection. try this: https://code.earthengine.google.com/6785ff832e6b98e1529e92970e38591c
LikeLike