
Cumulative changes in Carbon storage over time
This tool calculates the the cumulative changes in carbon storage using the extensive MODIS satellite archive in combination with the processing power of the Google earth Engine. The tool is quite similar to the ecodash, which uses the “Enhanced Vegetation Index” as measure of an area’s bioproductivity.
This post is a step-by-step guide on how to build the tool.
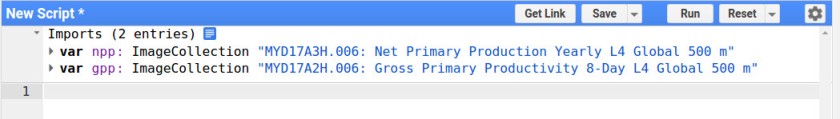
1. Import the “MYD17A2H.006: Gross Primary Productivity 8-Day L4 Global 500 m” and “MYD17A3H.006: Net Primary Production Yearly L4 Global 500 m”.
2. Import the Da basin into the GEE.
// import the sub basins as a fusion table
var Da = ee.FeatureCollection('ft:15ytieQkq3UH8DPJPFmB_YnbvhSEhOQLtLIXa6kxA').geometry();

// Set center of map
Map.centerObject(Da, 6);

// show the layer
Map.addLayer(Da);
3. Filter the image collection based on location and time.
// set start and end date
var startdate = ee.Date.fromYMD(2002,1,1);
var enddate = ee.Date.fromYMD(2014,12,1);

// filter imagecollection based on date and area
var GPP = gpp.select('Gpp').filterDate(startdate, enddate).filterBounds(Da);
var NPP = npp.select('Npp').filterDate(startdate, enddate).filterBounds(Da);
4. Calculate the 8-daily npp using the gpp
// for every 8 days
GPP = GPP.map(function(img) {
  // get the date of the image
  var d = ee.Date(img.get('system:time_start'));
  // get the year
  var y = d.get('year');
  // sum the gpp for that year
  var gpp_sum  = GPP.filter(ee.Filter.calendarRange(y, y, 'year')).sum();
  // calculate the gpp as a fraction of the yearly value
  var gpp_fraction  = img.divide(gpp_sum).rename("gpp_fraction");

  // Get the yearly npp map
  var myNPP = ee.Image(NPP.filter(ee.Filter.calendarRange(y, y, 'year')).sum());
  // mulitply the yearly npp with the fractional gpp
  var netNPP = gpp_fraction.multiply(myNPP).rename('netpp');

  return img.addBands(netNPP);
});
5. Create a new collection from the net NPP you just created.
// create a collection of the net npp
var collection = GPP.select('netpp')
6. Define the reference conditions.
// Define reference conditions from the first 10 years of data.
var reference = collection.filterDate('2002-01-01', '2012-12-31')
  // Sort chronologically in descending order.
  .sort('system:time_start', false);
7. Compute the mean of the reference data
// Compute the mean of the first 10 years.
var mean = reference.mean();
8. Compute the anomalies by subtracting the mean from each image in the period 2012 – 2016.
// Compute anomalies by subtracting the 2001-2012 mean from each image in a
// collection of 2012-2016 images. Copy the date metadata over to the
// computed anomaly images in the new collection.
var series = collection.filterDate('2012-01-01', '2016-12-31').map(function(image) {
    return image.subtract(mean).set('system:time_start', image.get('system:time_start'));
});
9. Display the mean of the anomalies.
// Display cumulative anomalies.
Map.addLayer(series.mean(),
    {min: -150, max: 150, palette: ['FF0000', '000000', '00FF00']}, 'Npp anomaly');
See example here.
In the next step you are going to calculate the cumulative anomaly.
10. Create the initial image for the first image with the timestamp of the first image.
// Get the timestamp from the most recent image in the reference collection.
var time0 = reference.first().get('system:time_start');

// Use imageCollection.iterate() to make a collection of cumulative anomaly over time.
// The initial value for iterate() is a list of anomaly images already processed.
// The first anomaly image in the list is just 0, with the time0 timestamp.
var first = ee.List([
  // Rename the first band 'EVI'.
  ee.Image(0).set('system:time_start', time0).select([0], ['netpp'])
]);
11. Apply the iterate function to calculate the cumulative anomaly of the image collection.
// This is a function to pass to Iterate().
// As anomaly images are computed, add them to the list.
var accumulate = function(image, list) {
  // Get the latest cumulative anomaly image from the end of the list with
  // get(-1).  Since the type of the list argument to the function is unknown,
  // it needs to be cast to a List.  Since the return type of get() is unknown,
  // cast it to Image.
  var previous = ee.Image(ee.List(list).get(-1));
  // Add the current anomaly to make a new cumulative anomaly image.
  var added = image.add(previous)
    // Propagate metadata to the new image.
    .set('system:time_start', image.get('system:time_start'));
  // Return the list with the cumulative anomaly inserted.
  return ee.List(list).add(added);
};

// Create an ImageCollection of cumulative anomaly images by iterating.
// Since the return type of iterate is unknown, it needs to be cast to a List.
var cumulative = ee.ImageCollection(ee.List(series.iterate(accumulate, first)));
12. Create a chart using a reducer on the Da basin.
// Predefine the chart titles.
var title = {
  title: 'Cumulative C anomaly over time',
  hAxis: {title: 'Time'},
  vAxis: {title: 'Cumulative C anomaly'},
};

// print the chart
print(Chart.image.seriesByRegion(cumulative,
                                 Da,
                                ee.Reducer.mean(),
                                'netpp',
                                500,
                                'system:time_start',
                                'PROJECT').setOptions(title));

Hello, can you please tell me the reference for the equation “NPP8 = (GPP8 / GPPy) x NPP y” used in this.
I couldn’t get such reference in my literature review.
LikeLike