
Sometimes you just like to have the data on your own harddrive.
The moderate-resolution imaging spectroradiometer (MODIS) satellite with 36 spectral bands with varying spatial resolutions (2 bands at 250 m, 5 bands at 500 m and 29 bands at 1 km). The Terra satellite was launched in 1999, the Aqua in 2002. There are a number large number of readily available atmosphere, land and water products. Find an overview here.
In this assignment we are going to use two different products:
MOD13: The MOD13 product obtained from the MODIS satellite includes the Normalized Difference Vegetation Index (NDVI). Data is available for every 16 days.
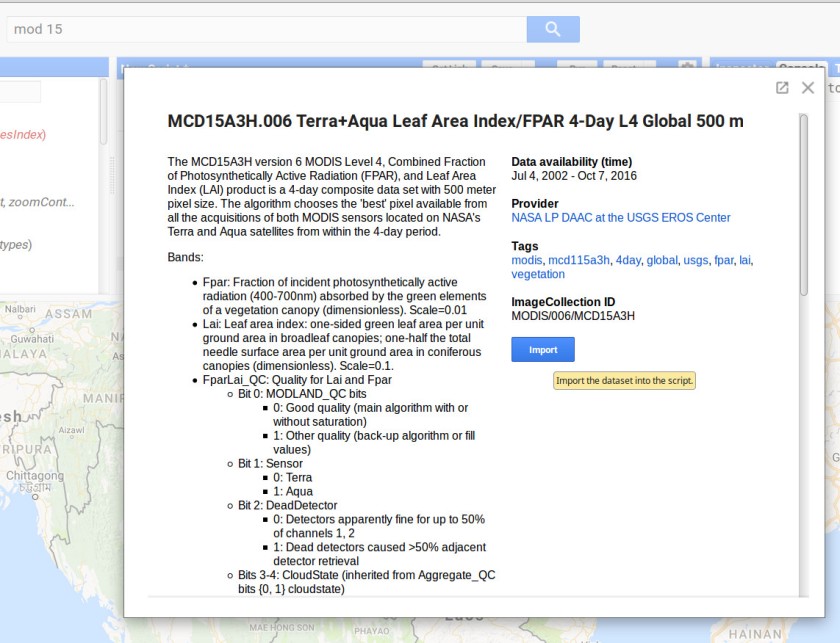
MOD15: The Fractional Photosynthetically Active Radiation (FPAR) and Leaf Area Index (LAI) obtained from the MODIS satellite is an 8 daily product with a spatial resolution of 500 meter.
Step 1: Open this script and save it to you private folder.
Step 2: Import the MOD13 (MOD13Q1) and MOD15 products.
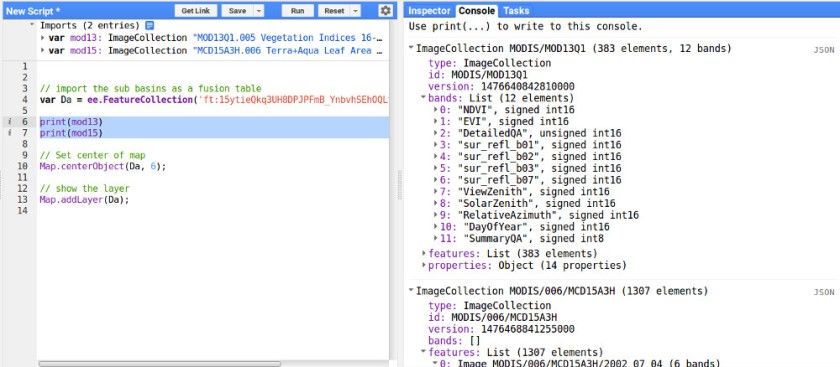
Step 3: print the output of both variables
print(mod13)
print(mod15)
In the console you can find all data in the imagecollection.
Step 4: Select the time period of interest, the location and variable of interest.
 // define study period
var startdate = ee.Date.fromYMD(2010,1,1);
var enddate = ee.Date.fromYMD(2011,12,31);

//  filter data on location and
var modNDVI = mod13.filterDate(startdate,enddate)
                   .filterBounds(Da)
                   .select("NDVI")

//  filter data on location and
var modFpar = mod15.filterDate(startdate,enddate)
                   .filterBounds(Da)
                   .select("Fpar")

//  filter data on location and
var modLAI = mod15.filterDate(startdate,enddate)
                   .filterBounds(Da)
                   .select("Lai")
Step 5: Create monthly maps for all data products. Below an example on how to create monthly data for the NDVI.
// create a list with all months
var months = ee.List.sequence(1,12);

// create a list with all years
var years = ee.List.sequence(2010,2011);

// create monthly maps
var monthlyNDVI =  ee.ImageCollection.fromImages(
  years.map(function (y) {
  return months.map(function(m){
  var w =  modNDVI.filter(ee.Filter.calendarRange(y, y, 'year'))
           .filter(ee.Filter.calendarRange(m, m, 'month'))
           .mean();
  return w.set('year', y)
           .set('month', m)
           .set('date', ee.Date.fromYMD(y,m,1))
           .set('system:time_start',ee.Date.fromYMD(y,m,1))

});
}).flatten());

// print the output
print(monthlyNDVI)
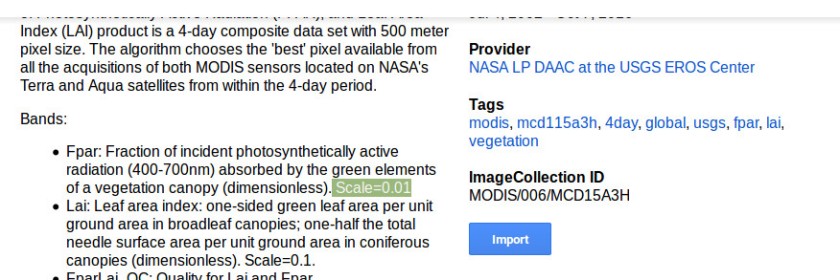
Step 6: As all images in the image collection are scaled, we need the multiply each image with the scale factor.
// Scale the NDVI with fac 0.0001
var scaleNDVI = function(img){
  return img.multiply(0.0001)
}

// scale every image in the collection
monthlyNDVI = monthlyNDVI.map(scaleNDVI);

// Scale the mod15 data
var scalemod15 = function(img){
  return img.multiply(0.01)
}

// Scale every image in the collection
monthlyFpar = monthlyFpar.map(scalemod15)
monthlyLAI = monthlyLAI.map(scalemod15)
step 7: add the mean of the image collection to the map canvas for visual inspection
// add layers to canvas
var colorndvi = {min:0.4, max:1, palette:"52ff0e,52cc22,26b031,276221"};
Map.addLayer(monthlyNDVI.mean().clip(Da),colorndvi,"NDVI");
var colorLAI = {min:0, max:0.8, palette:"befffc,6ae9ff,374eff,6f00ff"};
Map.addLayer(monthlyLAI.mean().clip(Da),colorLAI,"LAI");
var colorFpar = {min:0, max:0.8, palette:"f1ff8b,fbff54,ffc6a5,ff310e"};
Map.addLayer(monthlyFpar.mean().clip(Da),colorFpar,"Fpar");
There are three ways to store an ImageCollection in the Google Earth Engine. (1) to the google drive, (2) to the Google Cloud storage and (3) as an asset. Here the first option is shown. However, currently there is no easy way to batch export large dataseries.
// get metadata
var first = ee.Image(monthlyNDVI.first());
var crs = first.projection().crs().getInfo();
var scale = 1000;
var count =  monthlyNDVI.size().getInfo();

// set the counter
var counter = 0;

// loop through the year
for (var y = 2000; y < 2002 ; y++) {
  // loop through the months
  for (var m = 1; m < 12 ; m++) {

  // get the image
  var img = ee.Image(monthlyNDVI.toList(1, counter).get(0));

  // store the image
  Export.image.toDrive({
       image: img,
       description: y.toString() + m.toString(),
       scale: 1000,
    region: Da
 });
}}
See a final example here.

Hi Again! In your final example, when I run the code, I can download a .tif file of the maps. When I open it, it is blank, with nothing inside. Do I need to do something else? And thank you for this blog!!
LikeLike
what software do you use to open the tif?
LikeLike
GIMP. Here is just a transparent mask
LikeLike
Have you tried e.g. Qgis?
LikeLike
GIMP. Here is just a transparent mask
LikeLike
Qgis worked just fine! Thanks.
How do you know so much about GEE? I am having some doubts and using your blog, do you recommend any manual?
LikeLike
Please have a look at this site: https://developers.google.com/earth-engine/edu
LikeLike
Hi, I’m working on daily rainfall data from CHIRPS. I wanted to know how to combine the reduce() function, to get the monthly rainfall data ( based on your example, no problem) but on a particular area (from an imported assets).
Thank you, first for your very helpfull blog, and second for your help.
Best
LikeLike
I mean, how to get time series data on a monthly over several years
LikeLike
you could apply a clip?
LikeLike
look for ee.Filter.calendarRange() , if you want e.g. data from december collection.filter(ee.Filter.calendarRange(12,12,”month”))
LikeLike
Thank you for your answer. Based on the time series starting from 2015-01-01 to 2017-12-31. I tried to compute a time series, with collection.filter(ee.Filter.calendarRange(1,12,”month”)). But gives me the January-mean, the Feb-mean…I just wanted the value for JAN 2015, FEB 2015….DEC 2015, JAN-2016, FEB-2016, …, DEC-2016, JAN 2017, FEB 2017,…, DEC2017.
The data used, is Daily rainfall (CHIRPS). So the objective, is to get monthly rainfall on several polygons.
Sorry if I’m not clear,
Thank you.
LikeLike
Hi
thank you for your good blog
I have a problem when running this code and it’s that when downloading the images they are the same, why?
open those with arcgis10.7.1 and terrset
LikeLike
For the task result I retrieve that the output is 200011, 200111. What does it mean? Does 200011 mean, for November 2000?and Does 200111 mean for November 2001?
LikeLike