

Khám phá các khu vực căng thẳng sinh lý
Môi trường lý sinh là toàn bộ các yếu tố sinh học và vật lý bao quanh sinh vật hoặc quần thể sinh vật. Các yếu tố này có ảnh hưởng đến sự tồn tại, phát triển và tiến hóa của chúng.
Các tác động từ môi trường nhân văn cũng có thể ảnh hưởng đến môi trường lý sinh, đa dạng sinh học và các tài nguyên khác. Do vậy, giám sát hiện trạng lý sinh của một khu vực cụ thể là vô cùng quan trọng.
Viễn thám có thể được sử dụng để đánh giá hiện trạng môi trường lý sinh của một khu vực một cách nhanh và có hiệu quả kinh tế, trong khi đánh giá qua thực địa thường tốn thời gian và tài nguyên.
Step 1: Copy mẫu /template vào một script mới và điền thông tin chi tiết của người thực hiện, ngày tháng và thông tin liên lạc.
Step 2: Import tập ảnh MODIS/MYD13A1 và chọn EVI.
Step 3: Tạo tập một tập dữ liệu tham chiếu/reference dataset bằng lọc/filter thời gian từ 2000 – 2010.
// calculate reference
var reference = collection.filterDate('2001-01-01', '2010-12-31').sort('system:time_start', false);
// calculate the series
var series = EVI.filterDate('2001-01-01', '2010-12-31').sort('system:time_start', false).select("EVI");
Step 4: Tính mean/trung bình cho toàn bộ tập dữ liệu.
Step 5: Hiển thị Mean sử dụng dòng code dưới đây. Chọn những giá trị phù hợp cho min và max.
Map.addLayer(reference.mean(),
    {min: ??, max: ??, palette: ["fdff42","4bff0f","0fa713"]}, 'EVI mean');
Gợi ý! Sử dụng inspector để kiểm tra khoảng giá trị.
Step 6: Tạo một tập ảnh cho khoảng thời gian 2011 – 2016. Đặt tên cho tập ảnh là “series”..
Thảo luận nhóm xem dòng code đã thực hiện những gì.
var subtractmean = function(image) {
    return image.subtract(mean).set('system:time_start', image.get('system:time_start'));
};

// run all images in the image collection series in the substractmean function
var mapseries = series.map(subtractmean);
Step 7: Tìm timestamp/nhãn thời gian cho ảnh mới nhất trong tập dữ liệu tham chiếu
Map.addLayer(mapseries.mean(),
    {min: ??, max: ??, palette: ["931206","ff1b05","fdff42","4bff0f","0fa713"]}, 'EVI anomoly')
Step 8: Tìm timestamp/nhãn thời gian cho ảnh mới nhất trong tập dữ liệu tham chiếu.
// Get the timestamp from the most recent image in the reference collection.
var time0 = reference.first().get('system:time_start');
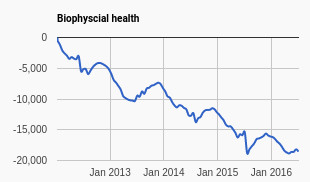
Bây giờ chúng ta sẽ thực hiện vẽ biểu đồ về tiến hóa của EVI theo thời gian. Chúng ta sử dụng các bản đồ dị thường vừa tạo. Chúng ta tính giá trị tích lũy của EVI cho một vùng cụ thể sử dụng hàm iterate.
Step 9: Tạo một danh sách bắt đầu từ giá trị 0
var first = ee.List([ee.Image(0).set('system:time_start', time0).select([0], ['EVI'])]);
step 10: Paste code sau vào code editor.
// This is a function to pass to Iterate().
// As anomaly images are computed, add them to the list.
var accumulate = function(image, list) {
        // Get the latest cumulative anomaly image from the end of the list with
        // get(-1).  Since the type of the list argument to the function is unknown,
        var previous = ee.Image(ee.List(list).get(-1));
        // Add the current anomaly to make a new cumulative anomaly image.
       var added = image.add(previous).set('system:time_start', image.get('system:time_start'));
        // Return the list with the cumulative anomaly inserted.
        return ee.List(list).add(added);
};

// Create an ImageCollection of cumulative anomaly images by iterating.
var cumulative = ee.ImageCollection(ee.List(mapseries.iterate(accumulate, first)));
Step 11: Thêm đối tượng hình học vào dữ liệu trong script
var geometry = ee.Geometry.Rectangle([105.0, 20.30, 106.5, 22.0]);
Step 12: Hiển thị vùng/polygon đó
Step 13: Copy dòng lệnh sau vào phần ‘User specified parameters’ của scipt.
// Predefine the chart titles.
var title = {
     title: 'Cumulative EVI anomaly over time',
      hAxis: {title: 'Time'},
      vAxis: {title: 'Cumulative EVI anomaly'},
};
Step 14: In biểu đồ của các bản đồ tích lũy sử dụng dòng code sau
print(Chart.image.seriesByRegion(cumulative, geometry, ee.Reducer.mean(), 'EVI', 500, 'system:time_start', 'PROJECT').setOptions(title));
Step 15: Hiển thị bản đồ lên màn hình:
Map.addLayer(mapseries.mean(),
    {min: -500, max: 500, palette: ["931206","ff1b05","fdff42","4bff0f","0fa713"]}, 'EVI anomoly');
Find an example here
