

Everyone can access satellite data now
In this exercise you will import and analyse satellite data from the sentinel 2 satellite.
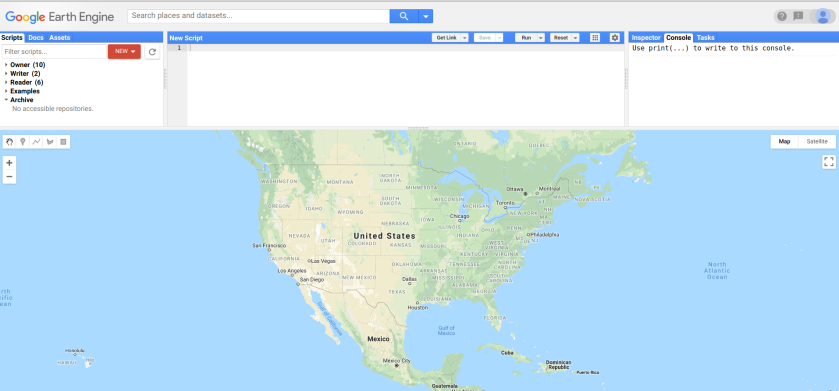
step 1: go to code.earthengine.google.com
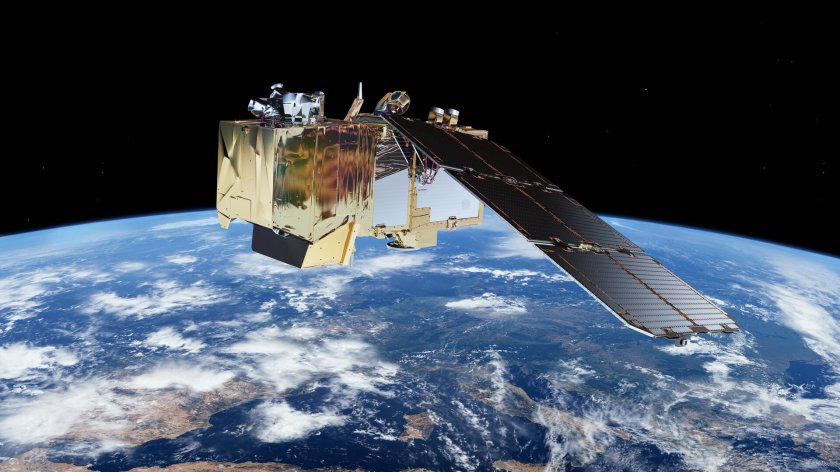
This is the Sentinel-2 satellite. It was launched by the European Space Agency
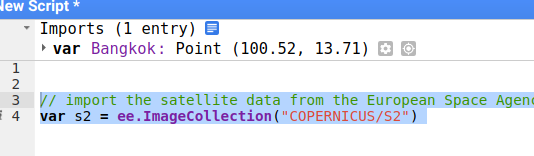
Step 2: import the data of the satellite into your script. Now you will be able to access all images ever taken by the satellite.
// import the satellite data from the European Space Agency
var s2 = ee.ImageCollection("COPERNICUS/S2")
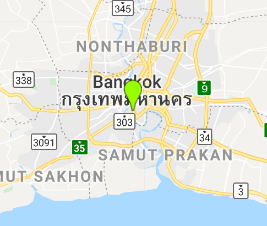
We only want images from Bangkok.
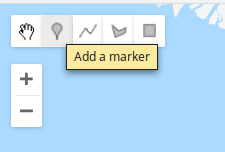
Step 3: Add a marker on Bangkok and name it Bankgok
now we filter to only include images for Bangkok.
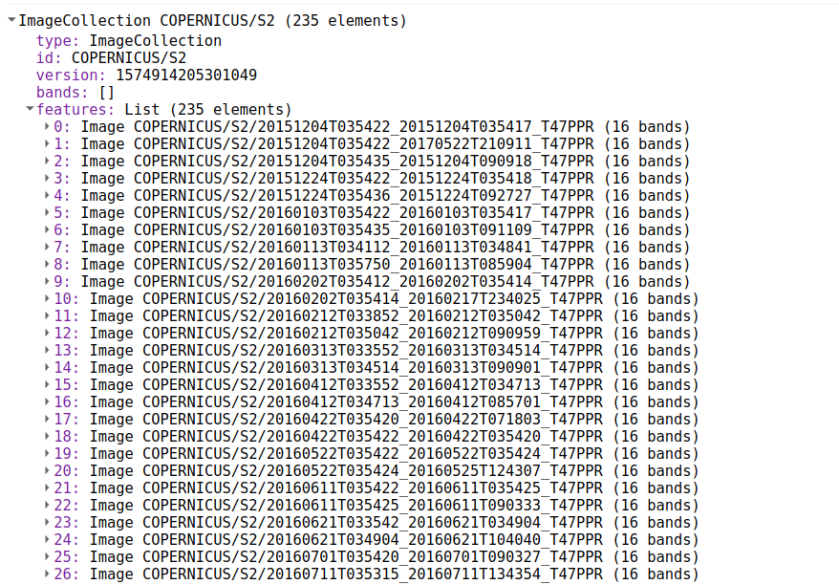
Step 4: use filterBounds to filter for bangkok
// filter for Bangkok
s2 = s2.filterBounds(Bangkok);
// print the result
print(s2);
The list shows all images that were taken of Bangkok
We want a recent image, so we also filter for date
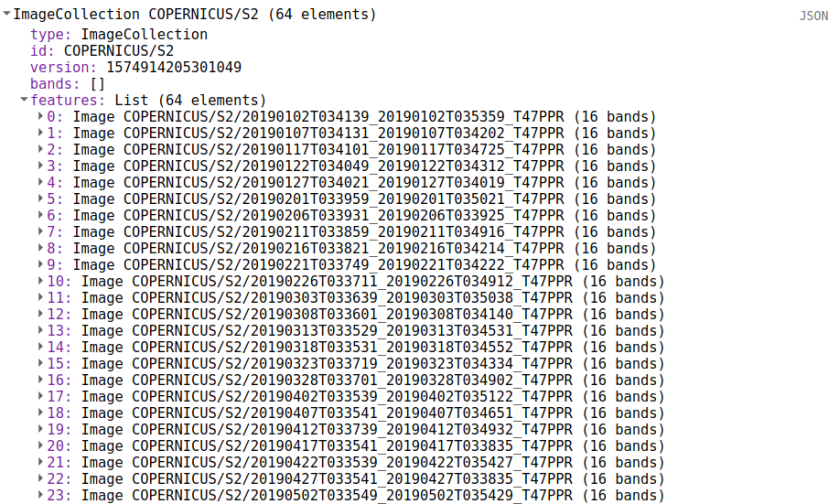
Step 4: use the filterDate to filter for the year 2019
// filter for date
s2 = s2.filterDate("2019-01-01","2019-12-31");
// print the result
print(s2);
We have 64 images for 2019
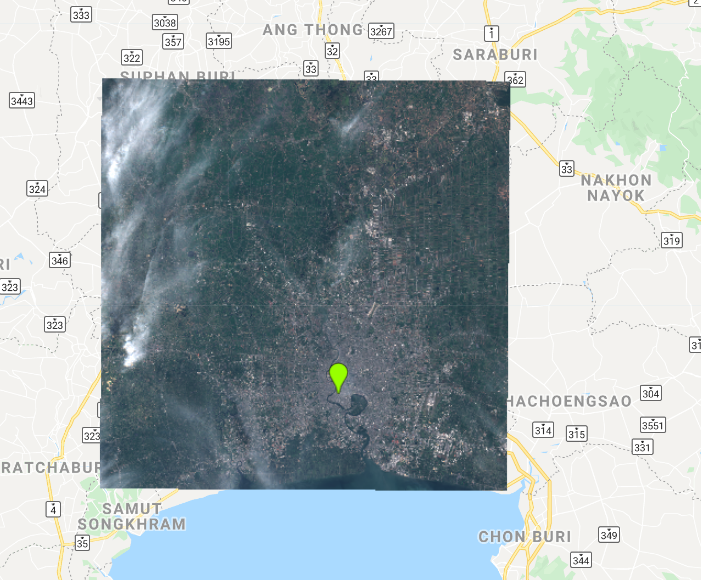
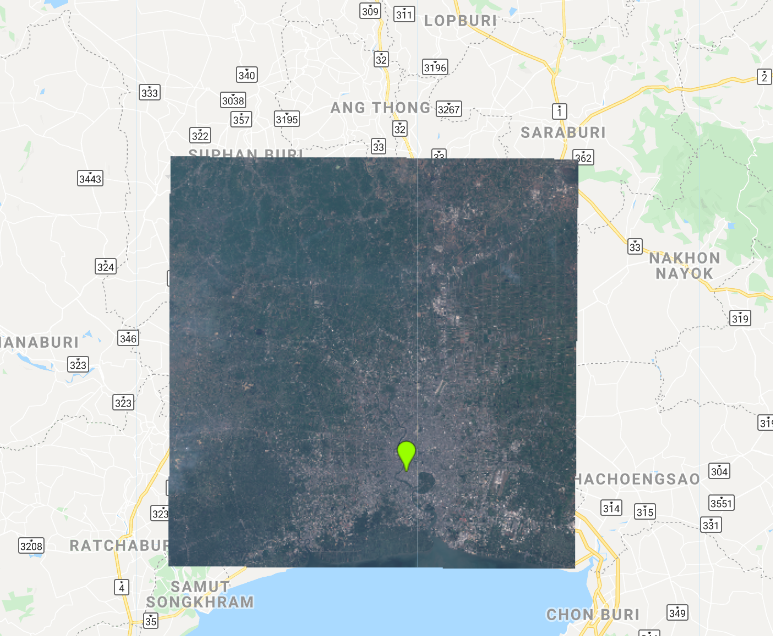
Now we want to display the image. We use bands 2, 3 and 4 to display the image. These bands represent the blue, green and red bands.
Step 5: use map.addLayer() to display the image
// get the first image
var image = ee.Image(s2.first());
// show the image
Map.addLayer(image,{min:0,max:3000,bands:"B4,B3,B2"},"Bangkok");
The previous image contains clouds. We want to see the image with least clouds.
Step 6: use sort to sort the collection based on cloud cover
// sort the image collection
var s2 = s2.sort("CLOUDY_PIXEL_PERCENTAGE");
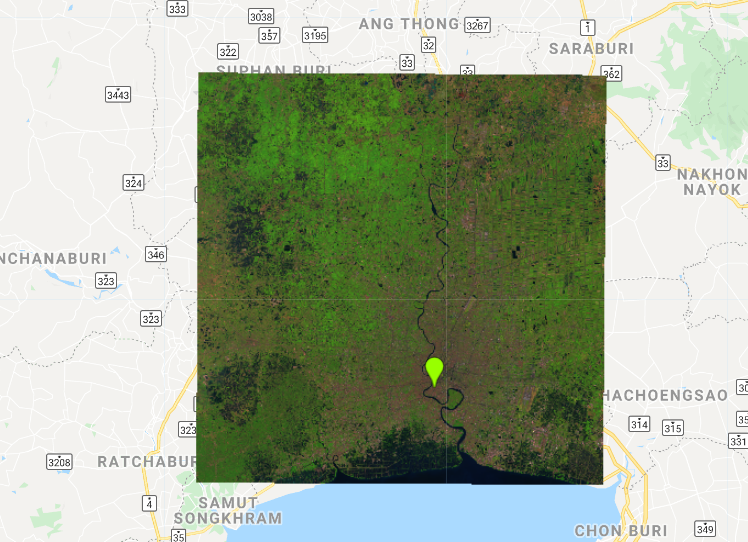
Often we investigate the data in other colors. This is called false color. We display the data in Shortwave infrared, infrared and red.
// show the image
Map.addLayer(image,{min:0,max:6000,bands:"B11,B8,B4"},"false color Bangkok");
Satellite imagery is very useful to analyse the landscape. you can use it to locate urban, water, vegetation etc. The equation below is used to calculate the Normalized Difference Water Index (NDWI).
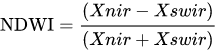
Step 7: calculate the NDWI using the code below.
//calculate the Normalized Difference Water Index (NDWI) from nir and swir (nir-swir) / (nir+swir)
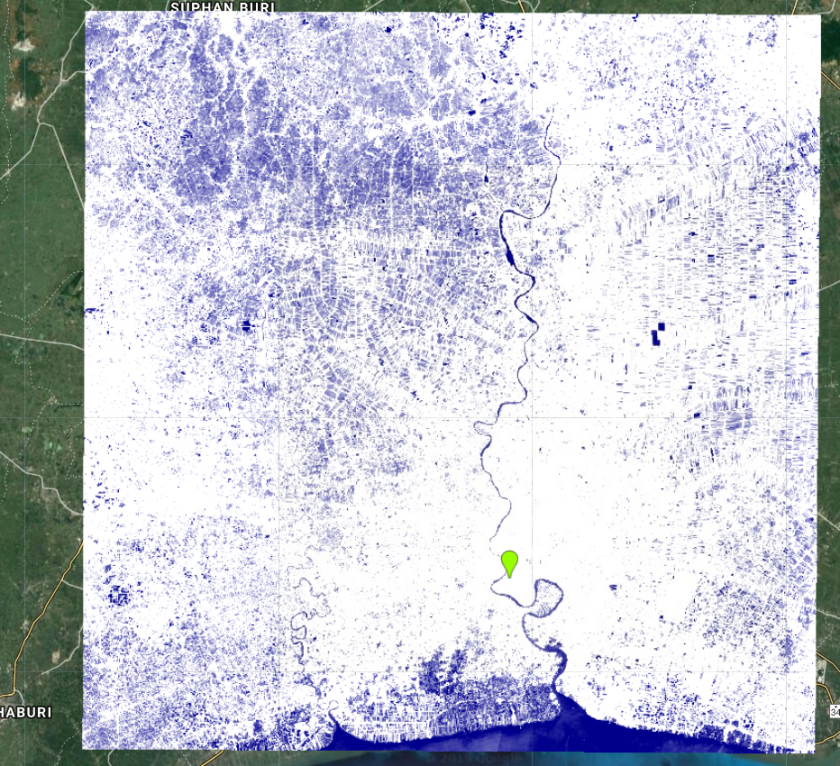
var ndwi = image.normalizedDifference(["B8","B11"])
Map.addLayer(ndwi,{min:0.2,max:0.5,palette:"white,darkblue"},"ndwi")

Good morning, congratulations on your site and posts.
Would you like to ask some questions could you enter your e-mail?
LikeLike