
Analyse population dynamics
Step 1: import the administrative boundaries used for selecting the area of interest
// define the countries of interest in this list
var countryList = ["Cambodia","Vietnam","Laos","Burma","Thailand"];
// import the country boundaries and filter for the countries of interest
var countries = ee.FeatureCollection('USDOS/LSIB_SIMPLE/2017').filter(ee.Filter.inList("country_na", countryList));
// add the layer to the map
Map.addLayer(countries,{},"countries of interest");
Step 2: import the worldPop dataset and filter for area of interest
// import worldpop data
var wp = ee.ImageCollection("WorldPop/GP/100m/pop").filterBounds(countries);
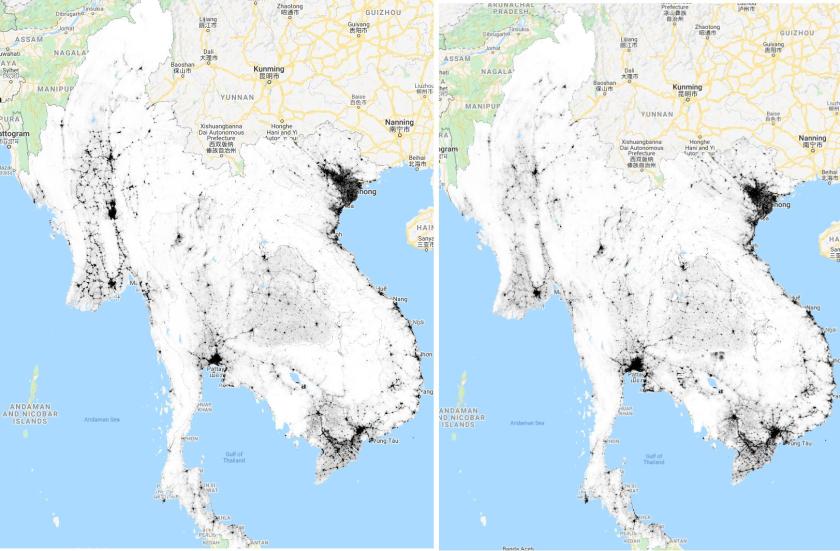
Step 3: filter for date and show the results of they year 2000
// set the start and end dates
var start = ee.Date.fromYMD(2000,1,1);
var end = ee.Date.fromYMD(2000,12,31);

// filter for the period of interest
var wp2000 = ee.Image(wp.filterDate(start,end).mean());
// clip for the area of interest
wp2000 = wp2000.clip(countries);
Map.addLayer(wp2000,{min:0,max:10,palette:['white','gray','black']},"population 2000");
step 4: do the same for the year 2020
// set the start and end dates
var start = ee.Date.fromYMD(2020,1,1);
var end = ee.Date.fromYMD(2020,12,31);

// filter for the period of interest
var wp2020 = ee.Image(wp.filterDate(start,end).mean());
// clip for the area of interest
wp2020 = wp2020.clip(countries);
Map.addLayer(wp2020,{min:0,max:10,palette:['white','gray','black']},"population 2020");
see the full code here

Hi, is it possible to find a sum of population – within a specified polygon – using the WorldPop image collection? (ee.ImageCollection(“WorldPop/GP/100m/pop”))
LikeLike