
Analyse night light dynamics
Step 1: import the nightlight image collection and display the results
// import the nightlight image collection
var nightlight = ee.ImageCollection("NOAA/VIIRS/DNB/MONTHLY_V1/VCMSLCFG").select("avg_rad");
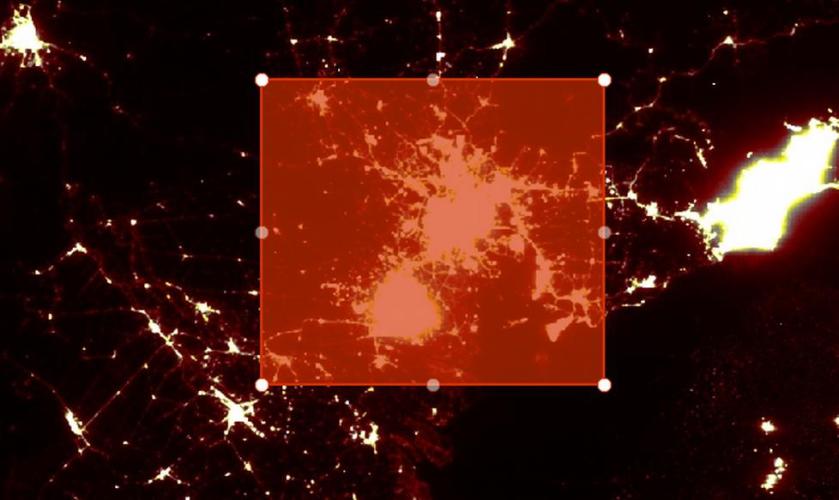
Map.addLayer(nightlight.mean(),{min:0,max:10,palette:['000000','700000','808080','FFFF00','ffffff','ffffff','ffffff']},"nightlights");
Step 2: draw an area of interest using the tool on the map.

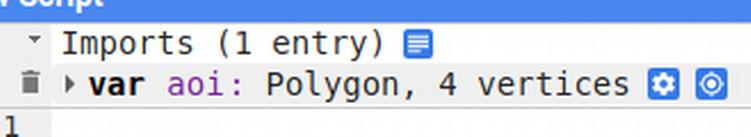
step 3: rename the geometry to aoi
step 4: Define the chart and print it to the console.
// Define the chart and print it to the console.
var chart =
    ui.Chart.image
        .series({
          imageCollection: nightlight,
          region: aoi,
          reducer: ee.Reducer.mean(),
          scale: 500,
          xProperty: 'system:time_start'
        })
        .setSeriesNames(['avg_rad'])
        .setOptions({
          title: 'Date',
          hAxis: {title: 'Date', titleTextStyle: {italic: false, bold: true}},
          vAxis: {
            title: 'average nighlight',
            titleTextStyle: {italic: false, bold: true}
          },
          lineWidth: 5,
          colors: ['e37d05'],
          curveType: 'function'
        });

print(chart);
Click this link for the full code.
