
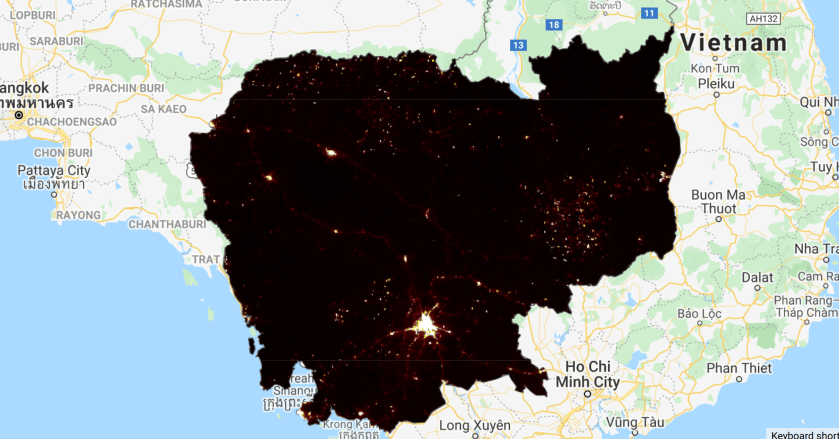
over Cambodia
var nightlight2014 = ee.Image("NOAA/VIIRS/DNB/MONTHLY_V1/VCMSLCFG/20140101").select("avg_rad");
print(nightlight2014)
Map.addLayer(nightlight2014,{min:0,max:10,palette:['000000','700000','808080','FFFF00','ffffff','ffffff','ffffff']},"nightlights 2014");

var nightlight2021 = ee.Image("NOAA/VIIRS/DNB/MONTHLY_V1/VCMSLCFG/20210101").select("avg_rad");
print(nightlight2021)
Map.addLayer(nightlight2021,{min:0,max:10,palette:['000000','700000','808080','FFFF00','ffffff','ffffff','ffffff']},"nightlights 2021");
We clip the map for Cambodia
// import country layers
var countries = ee.FeatureCollection("USDOS/LSIB_SIMPLE/2017");

Map.addLayer(countries,{},"countries");

// select Cambodia
var kh = countries.filter(ee.Filter.eq("country_na", "??"));
Map.addLayer(kh.draw("red"),{},"Cambodia");


var nightlight2014 = ee.Image("NOAA/VIIRS/DNB/MONTHLY_V1/VCMSLCFG/20140101").select("avg_rad");
print(nightlight2014)
Map.addLayer(nightlight2014.clip(??),{min:0,max:10,palette:['000000','700000','808080','FFFF00','ffffff','ffffff','ffffff']},"nightlights 2014");

var nightlight2021 = ee.Image("NOAA/VIIRS/DNB/MONTHLY_V1/VCMSLCFG/20210101").select("avg_rad");
print(nightlight2021)
Map.addLayer(nightlight2021.clip(??),{min:0,max:10,palette:['000000','700000','808080','FFFF00','ffffff','ffffff','ffffff']},"nightlights 2021");
and we try the same at the district level
var districts = ee.FeatureCollection("projects/servir-mekong/admin/KHM_adm2");
// create list with districts of interest
var myDistricts = ee.List(["Phnom Penh","Dangkao","Ta Khmau"]);

// we filter for the area of interst
var aoi = districts.filter(ee.Filter.inList("NAME_2",myDistricts));


var nightlight2014 = ee.Image("NOAA/VIIRS/DNB/MONTHLY_V1/VCMSLCFG/20140101").select("avg_rad");
print(nightlight2014)
Map.addLayer(nightlight2014.clip(aoi),{min:0,max:10,palette:['000000','700000','808080','FFFF00','ffffff','ffffff','ffffff']},"nightlights 2014");

var nightlight2021 = ee.Image("NOAA/VIIRS/DNB/MONTHLY_V1/VCMSLCFG/20210101").select("avg_rad");
print(nightlight2021)
Map.addLayer(nightlight2021.clip(??),{min:0,max:10,palette:['000000','700000','808080','FFFF00','ffffff','ffffff','ffffff']},"nightlights 2021");

print(nightlight2014.reduceRegion({reducer:ee.Reducer.mean(),geometry:??,scale:500}))
print(nightlight2021.reduceRegion({reducer:ee.Reducer.mean(),geometry:??,scale:500}))
We clear the script and now we will use the image collection instead of separate images
// import the nightlight image collection
var nightlight = ee.ImageCollection("NOAA/VIIRS/DNB/MONTHLY_V1/VCMSLCFG").select("avg_rad");

Map.addLayer(nightlight.mean(),{min:0,max:10,palette:['000000','700000','808080','FFFF00','ffffff','ffffff','ffffff']},"nightlights");
We calculate the min and the max
Map.addLayer(nightlight.min(),{min:0,max:10,palette:['000000','700000','808080','FFFF00','ffffff','ffffff','ffffff']},"minimum");
Map.addLayer(nightlight.max(),{min:0,max:10,palette:['000000','700000','808080','FFFF00','ffffff','ffffff','ffffff']},"maximum");
now we look at the time series at the country level
// select Cambodia
var kh = countries.filter(ee.Filter.eq("country_na", "Cambodia"));
Map.addLayer(kh.draw("red"),{},"Cambodia");

// Define the chart and print it to the console.
var chart =
    ui.Chart.image
        .series({
          imageCollection: nightlight,
          region: kh,
          reducer: ee.Reducer.mean(),
          scale: 500,
          xProperty: 'system:time_start'
        })
        .setSeriesNames(['avg_rad'])
        .setOptions({
          title: 'Date',
          hAxis: {title: 'Date', titleTextStyle: {italic: false, bold: true}},
          vAxis: {
            title: 'average nighlight',
            titleTextStyle: {italic: false, bold: true}
          },
          lineWidth: 5,
          colors: ['e37d05'],
          curveType: 'function'
        });

print(chart);
and we do the same for Phnom Penh
// import administrative layers
var provinces = ee.FeatureCollection("projects/servir-mekong/admin/KHM_adm1");
// show layers on map
Map.addLayer(provinces,{},"provinces");

var pp = provinces.filter(ee.Filter.eq("NAME_1","Phnom Penh"))

var chart =
    ui.Chart.image
        .series({
          imageCollection: nightlight,
          region: pp,
          reducer: ee.Reducer.mean(),
          scale: 500,
          xProperty: 'system:time_start'
        })
        .setSeriesNames(['avg_rad'])
        .setOptions({
          title: 'Date',
          hAxis: {title: 'Date', titleTextStyle: {italic: false, bold: true}},
          vAxis: {
            title: 'average nighlight Phnom Penh',
            titleTextStyle: {italic: false, bold: true}
          },
          lineWidth: 5,
          colors: ['e37d05'],
          curveType: 'function'
        });

print(chart);
