
looking at time series
Step 1: import the administrative boundaries used for selecting the area of interest
// define the countries of interest in this list
var countryList = ["Cambodia"];
// import the country boundaries and filter for the countries of interest
var countries = ee.FeatureCollection('USDOS/LSIB_SIMPLE/2017').filter(ee.Filter.inList("country_na", countryList));
// add the layer to the map
Map.addLayer(countries,{},"countries of interest")
Step 2: import the worldPop dataset and filter for area of interest
// import worldpop data
var wp = ee.ImageCollection("WorldPop/GP/100m/pop").filterBounds(countries);
Step 3: filter for date and show the results of they year 2000
// set the start and end dates
var start = ee.Date.fromYMD(2000,1,1);
var end = ee.Date.fromYMD(2000,12,31);
// filter for the period of interest
var wp2000 = ee.Image(wp.filterDate(start,end).mean());
// clip for the area of interest
wp2000 = wp2000.clip(countries);
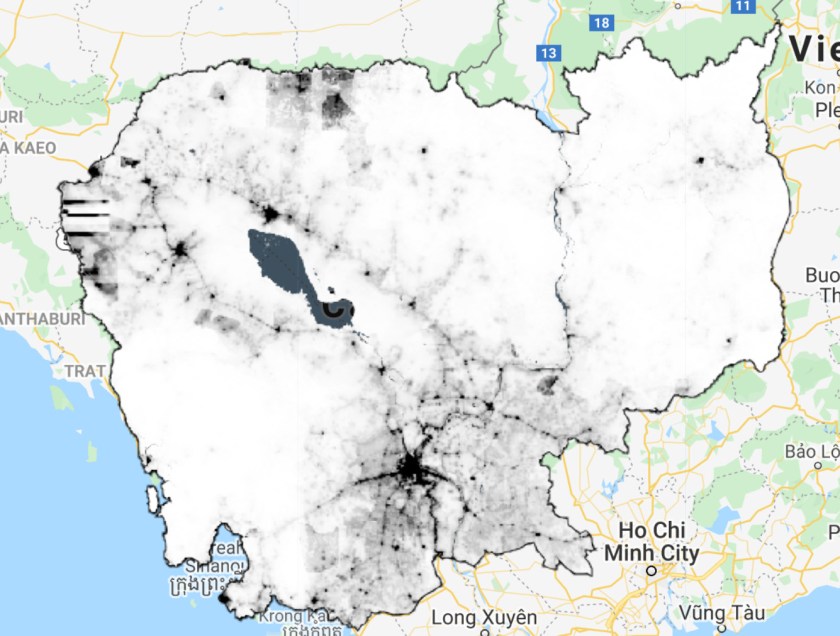
Map.addLayer(wp2000,{min:0,max:10,palette:['white','gray','black']},"population 2000");
step 4: do the same for the year 2020
// set the start and end dates
var start = ee.Date.fromYMD(2020,1,1);
var end = ee.Date.fromYMD(2020,12,31);

// filter for the period of interest
var wp2020 = ee.Image(wp.filterDate(start,end).mean());
// clip for the area of interest
wp2020 = wp2020.clip(countries);
Map.addLayer(wp2020,{min:0,max:10,palette:['white','gray','black']},"population 2020");
step 5: copy the code below to calculate the total population
var totalPopulation2000 = wp2000.reduceRegion({reducer:ee.Reducer.sum(),scale:100,maxPixels:1e13,geometry:countries});
print(totalPopulation2000);

var totalPopulation2020 = wp2020.reduceRegion({reducer:ee.Reducer.sum(),scale:100,maxPixels:1e13,geometry:countries});
print(totalPopulation2020);
step 6: use the code below to study the population dynamics from 2000 – 2020
// Define the chart and print it to the console.
var chart =
    ui.Chart.image.seriesByRegion
        ({
          imageCollection:wp,
          regions: countries,
          reducer: ee.Reducer.sum(),
          scale: 100,
          xProperty: 'system:time_start'
        })
        .setSeriesNames(['population'])
        .setOptions({
          title: 'population dynamics',
          hAxis: {title: 'Date', titleTextStyle: {italic: false, bold: true}},
          vAxis: {
            title: 'total population',
            titleTextStyle: {italic: false, bold: true}
          },
          lineWidth: 5,
          colors: ['e37d05'],
          curveType: 'function'
        });

print(chart);
step 7: import the administrative layers
// import administrative layers
var provinces = ee.FeatureCollection("projects/servir-mekong/admin/KHM_adm1");
var districts = ee.FeatureCollection("projects/servir-mekong/admin/KHM_adm2");
var townships = ee.FeatureCollection("projects/servir-mekong/admin/KHM_adm3");

// show layers on map
Map.addLayer(provinces,{},"provinces");
Map.addLayer(districts,{},"districts");
Map.addLayer(townships,{},"townships")
step 8: analyse the population per province
// Define the chart and print it to the console.
var chart =
    ui.Chart.image.byRegion
        ({
          image:wp2020,
          regions: provinces,
          reducer: ee.Reducer.sum(),
          scale: 100,
          xProperty: 'NAME_1'

        })
        .setSeriesNames(['population'])
        .setOptions({
          title: 'Population per province',
          hAxis: {title: 'Province', titleTextStyle: {italic: false, bold: true}},
          vAxis: {
            title: 'total population',
            titleTextStyle: {italic: false, bold: true}
          }
        }).setChartType('ColumnChart');;

print(chart);
Questions:
- how to calculate total population per district?
- how to calculate time series per province?
