
using landsat 8
In this exercise we will use landsat 8 to map surface water in Cambodia. We will apply cloud removal and calculate the NDWI.
Step 1: import the administrative boundaries of Cambodia
//Get the study area country boundary
var StudyArea = ee.FeatureCollection("projects/servir-mekong/Cambodia-Dashboard-tool/boundaries/cambodia_country");

//Add Shape file layer to the Map
Map.addLayer(StudyArea,{},"Cambodia");

//Center the Map with the Study Area
Map.centerObject(StudyArea, 8);
Step 2: import landsat 8 and filter for Cambodia
// Get a Landsat-8 TOA collection.
var L8_collection = ee.ImageCollection('LANDSAT/LC08/C01/T1_RT_TOA');

//Filter L8 image collection using shape file (or) boundary
var L8_StudyArea = L8_collection.filterBounds(StudyArea);
Step 3: we filter for the year 2020
// Define time range
var startyear = 2019;
var endyear = 2020;

// Set date in ee date format
var startdate = ee.Date.fromYMD(startyear,1,1);
var enddate = ee.Date.fromYMD(endyear,12,31);

//Filter L8 Image Collection with Date
var L8_SA_Date = L8_StudyArea.filterDate(startdate,enddate);
print("Total Images:",L8_SA_Date.size());
Step 4: we use a cloud function to remove clouds from the image
//Create Cloud Masking Function to remove clouds
var cloudfunction = function(image){
  // set cloud threshold
  var cloud_thresh = 40;
  //use add the cloud likelihood band to the image
  var CloudScore = ee.Algorithms.Landsat.simpleCloudScore(image);
  //isolate the cloud likelihood band
  var quality = CloudScore.select('cloud');
  //get pixels above the threshold
  var cloud01 = quality.gt(cloud_thresh);
  //create a mask from high likelihood pixels
  var cloudmask = image.mask().and(cloud01.not());
  //mask those pixels from the image
  return image.updateMask(cloudmask);
};

// mask all clouds in the image collection
var L8_NoCloud = L8_SA_Date.map(cloudfunction);

Map.addLayer(L8_NoCloud.mosaic().clip(StudyArea), { min:0.05, max: 0.8, bands: ['B6', 'B5', 'B4']},'Landsat 8 in study  region');
Step 5: we calculate the NDWI for each image in the collection
// Create function to calculate NDWI from landsat 8
//NDWI is Normalized Difference Water Index of NIR (B5) and Green (B3) bands
function Calculate_ndwi(img) {
  var ndwi = img.normalizedDifference(['B3', 'B5']).rename('NDWI');
  return img.addBands(ndwi);
}

var L8_ndwi = L8_NoCloud.map(Calculate_ndwi);
Step 6: we calculate 2 percentiles and use that information to derive the inundated area
//Set the threshold to difference between Dry and Wet Seasons
var DIFF_THRESHOLD = 0.4;
// select dry and wet conditions
var dry = L8_ndwi.select("NDWI").reduce(ee.Reducer.percentile([10]));
var wet = L8_ndwi.select("NDWI").reduce(ee.Reducer.percentile([90]));
var diff = wet.subtract(dry);
var indundatedArea = diff.updateMask(diff.gt(DIFF_THRESHOLD)).clip(StudyArea);
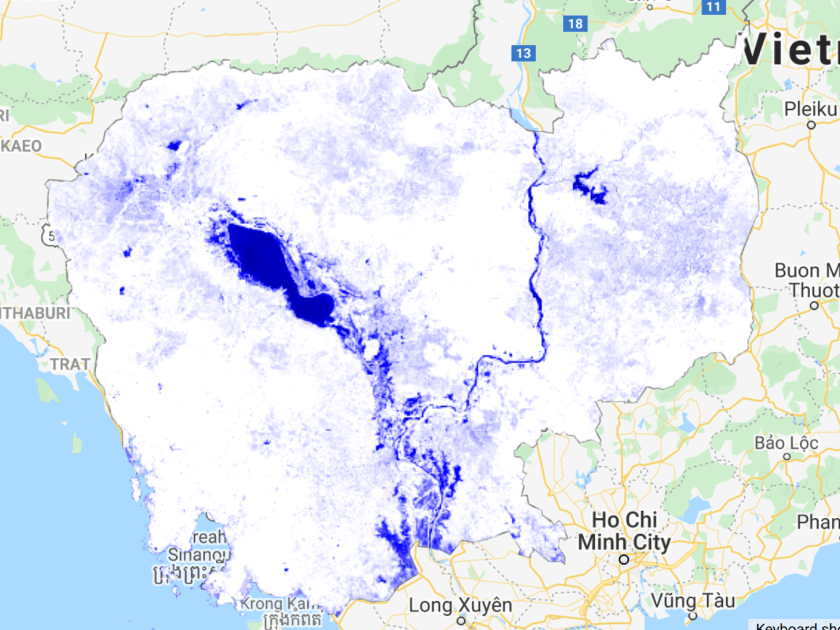
// add layers
Map.addLayer(dry.clip(StudyArea),{min:-0.3, max:0.4, palette:"white,blue,darkblue"},"dry");
Map.addLayer(wet.clip(StudyArea),{min:-0.3, max:0.8, palette:"white,blue,darkblue"}, "wet");
Map.addLayer(indundatedArea,{palette:"purple"}, "Indundated Area");
step 7 : we overlay the inundate area with the road network
//import road feature
var roads = ee.FeatureCollection('projects/servir-mekong/osm/cambodia/gis_osm_roads');

// create lists to categorize the road networks
var primary = ["primary","primary_link"];
var secondary = ["secondary","secondary_link"];
var tertiary = ["tertiary","tertiary_link"];
var other = ee.List(roads.aggregate_histogram("fclass").keys()).removeAll(primary).removeAll(secondary).removeAll(tertiary);

// filter for primary, secondary and tertiary roads
var primaryRoads = roads.filter(ee.Filter.inList("fclass",primary));
var secondaryRoads = roads.filter(ee.Filter.inList("fclass",secondary));
var tertiaryRoads = roads.filter(ee.Filter.inList("fclass",tertiary));
var otherRoads = roads.filter(ee.Filter.inList("fclass",other));

Map.addLayer(primaryRoads.draw("red"),{},"primary roads")
Map.addLayer(secondaryRoads.draw("blue"),{},"secondary roads")
Map.addLayer(tertiaryRoads.draw("green"),{},"tertiary roads")
Map.addLayer(otherRoads.draw("gray"),{},"other roads")
Step 8: add the dataset on buildings
var buildings = ee.FeatureCollection("projects/servir-mekong/undp/KHM_buildings/buildingsKhv1")
Map.addLayer(buildings,{}, "buildings"

Thanks a lot for this, really helpful!
LikeLike