
using tree canopy cover
in this exercise we will look at forest timeseries using a landsat derived dataset on tree canopy cover
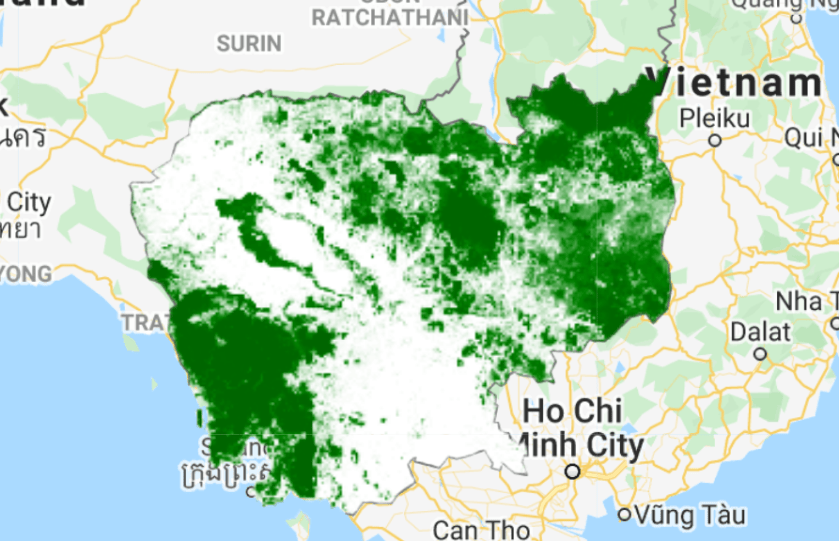
Step 1: import the tcc image collection and visualize some maps
// select Cambodia
var kh = ee.FeatureCollection("projects/servir-mekong/admin/KHM_adm0");

// import the tcc dataseries
var tcc = ee.ImageCollection("projects/servir-mekong/UMD/tree_canopy");

// import tree canopy cover data
var tcc2000 = tcc.filterDate("2000-1-1","2000-12-1").first().clip(kh);
var tcc2020 = tcc.filterDate("2020-1-1","2020-12-1").first().clip(kh);

// add tcc to the map
Map.addLayer(tcc2000,{min:0,max:100,palette:"white,green,darkgreen"},"tree canopy cover 2000");
Map.addLayer(tcc2020,{min:0,max:100,palette:"white,green,darkgreen"},"tree canopy cover 2020");
Step 2: calculate forest area for 2000 and 2020 using a 10% threshold
// use 10% as a threshold for forest
var forest2000  = tcc2000.gt(10);
var forest2020  = tcc2020.gt(10);

// add forest layer to the map
Map.addLayer(forest2000,{min:0,max:1,palette:"white,darkgreen"},"Forest 2000");
Map.addLayer(forest2020,{min:0,max:1,palette:"white,darkgreen"},"Forest 2020")
Step 3: map the forest loss between 2000 and 2020
var forestLoss = forest2000.and(forest2020.eq(0))
Map.addLayer(forestLoss,{min:0,max:1,palette:"white,red"},"forest loss");
Step 4: use a function to create a image collection with forest layers
var calcForest = function(img){
  var forest = img.gt(10).set("system:time_start",img.get("system:time_start"));
  return forest};

var forest = tcc.map(calcForest);
Step 5: create a chart for forest pixel area
// Define the chart and print it to the console.
var chart =
    ui.Chart.image
        .series({
          imageCollection: forest,
          region: kh,
          reducer: ee.Reducer.sum(),
          scale: 300,
          xProperty: 'system:time_start'
        })
        .setSeriesNames(['forest'])
        .setOptions({
          title: 'Date',
          hAxis: {title: 'Date', titleTextStyle: {italic: false, bold: true}},
          vAxis: {
            title: 'forest pixel area',
            titleTextStyle: {italic: false, bold: true}
          },
          lineWidth: 5,
          colors: ['e37d05'],
          curveType: 'function'
        });

print(chart);
Step 6: analyse the forest cover per province
// define the provinces of interest
var provinces = ee.FeatureCollection("projects/servir-mekong/admin/KHM_adm1");

var chart =
    ui.Chart.image.byRegion
        ({
          image:forest2000,
          regions: provinces,
          reducer: ee.Reducer.sum(),
          scale: 100,
          xProperty: 'NAME_1'
        })
        .setSeriesNames(['loss area'])
        .setChartType('ColumnChart')
        .setOptions({
          title: 'forest loss',
          hAxis: {title: 'Date', titleTextStyle: {italic: false, bold: true}},
          vAxis: {
            title: 'area loss (ha)',
            titleTextStyle: {italic: false, bold: true}
          },
          lineWidth: 5,
          colors: ['red'],
          curveType: 'function'
        });

print(chart);
step 7: select one province of interest and analyse the time series
// select the province of interest
var mondolkiri = provinces.filter(ee.Filter.eq("NAME_1","Kaôh Kong"));
Map.addLayer(mondolkiri,{},"Kaôh Kong");


// Define the chart and print it to the console.
var chart =
    ui.Chart.image
        .series({
          imageCollection: forest,
          region: mondolkiri,
          reducer: ee.Reducer.sum(),
          scale: 90,
          xProperty: 'system:time_start'
        })
        .setSeriesNames(['forest'])
        .setOptions({
          title: 'Date',
          hAxis: {title: 'Date', titleTextStyle: {italic: false, bold: true}},
          vAxis: {
            title: 'Kaôh Kong pixel area',
            titleTextStyle: {italic: false, bold: true}
          },
          lineWidth: 5,
          colors: ['e37d05'],
          curveType: 'function'
        });

print(chart);
