
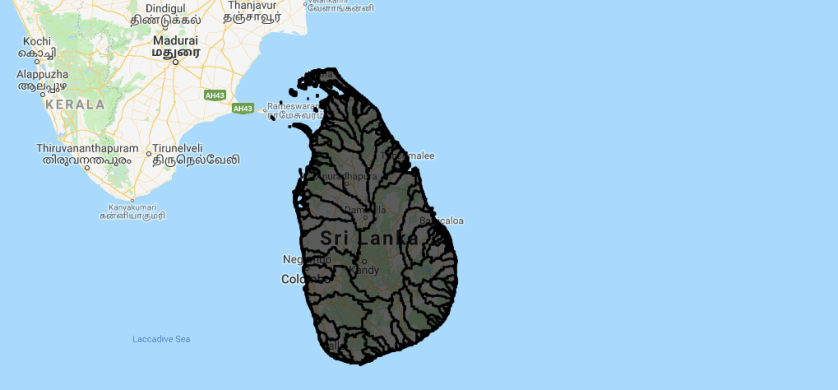
Upload hydrobasins and calculate P
hydrosheds.org has data on hydrographic information for regional and global-scale applications.
Step 1: Download this file and ingest it to the earth engine: basins
Step 2: import the data and add the data to the map.
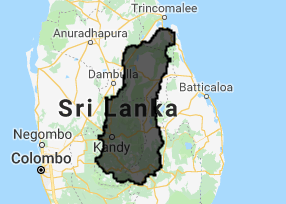
Step 3: use the inspector to select a basin.
var myBasin = basins.filter(ee.Filter.eq("BASIN_ID",???<span id="mce_SELREST_start" style="overflow:hidden;line-height:0"></span>))
Step 4: Setup the period of interest.
// variables for start and end year
var startyear = 2000;
var endyear = 2016;

// variables for start and end month
var startmonth = 1;
var endmonth = 1;

// define start and end date
var startdate = ee.Date.fromYMD(startyear,startmonth,1);
var enddate = ee.Date.fromYMD(endyear+1,endmonth,1);

// create list for years
var years = ee.List.sequence(startyear,endyear);
Step 5: import chirps and filter for time period.
// select precipitation for time range
var P = chirps.filterDate(startdate, enddate)
  // Sort chronologically in descending order.
  .sort('system:time_start', false)
Step 6: import chirps and filter for time period.
// select precipitation for time range
var P = chirps.filterDate(startdate, enddate)
  // Sort chronologically in descending order.
  .sort('system:time_start', false)
Step 7: Include the snippet below to calculate the yearly amount of precipitation. What do we need at the location of the ???? Min, max, mean, sum?
// calculate yearly P
var yearlyP =  ee.ImageCollection.fromImages(
  years.map(function (y) {
  var w = P.filter(ee.Filter.calendarRange(y, y, 'year')).???();
  return w.set('year', y)
                        .set('date', ee.Date.fromYMD(y,1,1))
                        .set('system:time_start',ee.Date.fromYMD(y,1,1));

}));
Step 8: Now we are going to setup the visualization for an image and a barchart.
// set visualizaton parameters
var p_viz = {min:0.0, max:2400, palette:"000000,0000FF,FDFF92,FF2700,FF00E7"};

// Predefine the chart titles.
var title = {
  title: 'Yearly precipitation',
  hAxis: {title: 'Time'},
  vAxis: {title: 'Precipitation (mm)'},
};
Step 9 We create a chart from the yearly precipitation data, using the basin polygon as the area and a reducer to calculate the mean precipitation in that area.
var chart = ui.Chart.image.seriesByRegion(yearlyP,myBasin, ee.Reducer.mean(), 'precipitation', 2500, 'system:time_start', 'SITE')
.setOptions(title)
.setChartType('ColumnChart');
Step 9: Display the result. What do we need at the location of the ???? Min, max, mean, sum?
// plot the chart
print(chart)

// center the map
Map.centerObject(myBasin, 5);

// plot the map
Map.addLayer(yearlyP.mean().clip(myBasin),p_viz, "mean yearly P")
We are going to calculate the average monthly precipitation. This needs to be done in two steps:
1. calculate the total precipitation for each month using sum()
2. Calculate the average monthly precipitation using mean().
