

Calculate the Net Primary Production for every 8 days.
There are two MODIS product available, with information on NPP, which is the Net Primary Productivity (net flux of carbon from the atmosphere into green plants per unit time) and GPP (gross primary production; npp + cellular respiration).
NPP is available for every year, the GPP for every 8 days.
Since we are mostly interested in the Net Primary Productivity, we use the GPP to calculate the NPP for every 8 days using the formula below:
NPP8 = (GPP8 / GPPy) x NPP y
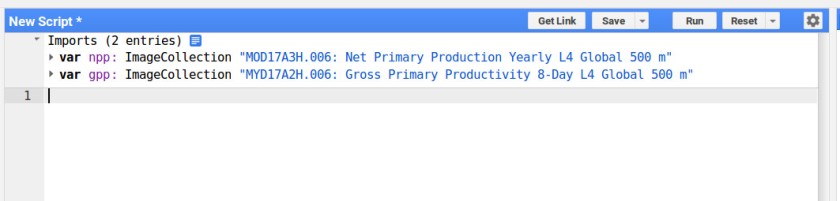
step 1: Import the (1) MOD17A3H.006: Net Primary Production Yearly L4 Global 500 m and (2) MYD17A2H.006: Gross Primary Productivity 8-Day L4 Global 500 m into the GEE.
Step 2: Add the countries of interest to your script:
// Define country names
var country_names = ['Laos','Vietnam','Cambodia'];
// import the country feasture collection
var countries = ee.FeatureCollection('ft:1tdSwUL7MVpOauSgRzqVTOwdfy17KDbw-1d9omPw')
// find the countries in the country list
var myCountries = countries.filter(ee.Filter.inList('Country', country_names));
// Get the geometry of the countries
var myRegion = myCountries.geometry();

// set location and zoom level
Map.centerObject(myRegion,4);

// add the layer
Map.addLayer(myRegion,false,"my region");
Step 3: filter for period and region of interest.
// Define period
var startdate = ee.Date.fromYMD(2010,1,1);
var enddate = ee.Date.fromYMD(2015,12,31);

// filter npp
var nppCollection = npp.filterDate(startdate, enddate)
                       .filterBounds(myRegion)
                       .select("Npp");
// filter gpp
var gppCollection = gpp.filterDate(startdate, enddate)
                       .filterBounds(myRegion)
                       .select("Gpp");
Step 4:
// calculate the npp8
var myNpp = function(myimg){
     // get date
     var d = ee.Date(myimg.get('system:time_start'))
     // get year
     var y = d.get('year').toInt();

     // filter for year for GPP and NPP
     var GPPy = ee.Image(gppCollection.filter(ee.Filter.calendarRange(y, y, 'year')).sum());
     var NPPy = ee.Image(nppCollection.filter(ee.Filter.calendarRange(y, y, 'year')).mean());
     var npp8 = myimg.expression('(GGP8 / GPPy) * NPPy',
    {
        GGP8: myimg,
        GPPy: GPPy,
        NPPy: NPPy
    });

  return npp8.copyProperties(myimg,['system:time_start'])
}

var npp8Collection = ee.ImageCollection(gppCollection.map(myNpp));

// create vizualtion settings
var npp_viz = {min:0.0, max:300, palette:"ff0000,f0ff00,004717"};

// add the image
Map.addLayer(npp8Collection.mean().clip(myRegion),npp_viz,"npp")
Find and example here.

Hello man. Is your calculation of biomass from NPP is right?
Quantity kg per m2 seems extremely high? I also calculate for my river basin in Bosnia and Herzegovina. Example:
4-Jul-10 1,278.70
LikeLike
My confusion come from literature citing, examples 45 kg per m2 per annum in the tropical rain forests. Please can zou explain accuretly computing to entire process biomass?
LikeLike
The npp in data in the GEE is measured in kg*C/m2, with scale 0.0001 (See below). This scale factor has not been applied in the code.
Npp: Net Primary Productivity (kg*C/m2). Scale=0.0001
LikeLike
Thanks man for answer. Why must scale? Why you not aplied in the code? If I good understood first step to calculate biomass, example in my water basin is calculated carbon storage from npp8. Next step is a multiply npp8 with molecular masses of hydrogen and oxygen (30/12)? In the chart represent calculated npp8 from example above 1,278.70 kg /m2 and when imultiply with 0.0001 results is 0.12807 kg C /m2. That results represented biomass production from NPP8? Also, pixels value in npp8 raster represented mean npp for that time period (in your example 01.01.2006.-31.12.2012.)?
LikeLike
What exactly would you like to calculate? I can have a look at your script if you like to. you can share it by clicking the get link button
LikeLike
Thanks man for answer on my questions and I m so pleased.
I want to calculate average daily biomass production example for 2004, 2005 …..Next step of my analysis is export raster (daily average for year) and calculate some statistics for Municipality teiritory in ArcGIS (zonal statistics tool). Also, I want analyze some certain periods during the year, like growing season or something like that.
https://code.earthengine.google.com/83934be60341d967958be9e458398600
LikeLiked by 1 person
Calculating daily biomass production is rather difficult as we only have data for each 8 days. In the code above, the npp is calculated for every 8 days using these data. NPP is only available on a yearly timescale. For the code you shared, I would take the sum rather than the mean to display the map. Also, you don’t need to multiply by 365 as no time resolution is included in the equation.
LikeLike
Ok, thans man. If I use sum in the code, SUM VALUE represents yearly sum biomass production and that results is on the map (example pixel value-2.4145 kg/m2 biomass for that year)? In charts I use mean and that refers average biomass production for period of 8 days?
LikeLike
Sorry, just one more question. What is it GGP8 in your script?
LikeLike
Hello man. I dont understood why you multiply NPP*(30/12). Have you any reference/link for that formula?
LikeLike
It’s a simple conversion from C to ch2o (biomass) (c = 12 u, o = 16 u, 2h = 2u)
LikeLike
Code for calculating biomass (kg/m2). That is correct?
https://code.earthengine.google.com/bec18520ff7769b0852c3b021a100f75
LikeLike
It’s the dry biomass in kg/m2. You might want to include a fraction of moisture content for fresh biomass. Please also check the articles below for reference.
Wim GM Bastiaanssen and Samia Ali. “A new crop yield forecasting model based on satellite
measurements applied across the Indus Basin, Pakistan”. In: Agriculture, ecosystems &
environment 94.3 (2003), pp. 321–340.
Sander J Zwart et al. “A global benchmark map of water productivity for rainfed and irrigated
wheat”. In: Agricultural Water Management 97.10 (2010), pp. 1617–1627.
LikeLike
Hello sir ,the biomass you estimated were accurate?
can we find biomass of wheat on this code.?
LikeLike
hello sir i want to calculate biomass of his,.i used this code but the result was not accurate,can you guide me what should i do?
LikeLike
hello sir i want to calculate biomass of his,.i used this code but the result was not accurate,can you guide me what should i do?
LikeLike
can we calculate the carbon stock of a forest using google earth engine?
LikeLike
yes. not sure if the modis npp and gpp products are the best for your purpose..
LikeLike
Thank you for the reply.
Can you share a link/manual on how we can calculate forest carbon stock using google earth engine?
There has been some studies on the calculation of forest carbon using landsat images, I believe similar and better studies can be done through google earth engine.
LikeLike
I’m not an expert on estimating forest carbon using RS.. but I don’t think there is a simple answer to your question. There are plethora of methods with all their cons and pro’s. Better ask contact an expert.
LikeLike
hello sir i want to calculate biomass of Wheat.i used this code but the result was not accurate,can you guide me what should i do?
LikeLike
Hello sir I’ve tried your code in GEE but the feature collection is not found. May I get the code feature collection of the countries?
LikeLike
Hello theearthsite,
I am willing to use terrestrial NPP data set and derive seasonal NPP values for my study area. Can you please provide me with the reference of the equation : “NPP8 = (GPP8 / GPPy) x NPP y” used in your code.
thank you very much in advance
LikeLike