
Map forest cover change for the period 2000 – 2017
step 1: add the area of interest
// set the area of interest
var chl = ee.FeatureCollection("users/servirmekong/Vietnam/CHL_Boundary").geometry();
print("the total area is:",chl.area())
step 2: import the tree canopy cover and tree height image collections
// import tree height
var th  = ee.ImageCollection("projects/servir-mekong/yearly_primitives_smoothed/tree_height");
// import tree canopy cover
var cc = ee.ImageCollection("projects/servir-mekong/yearly_primitives_smoothed/tree_canopy");
step 3: Set the thresholds
// Forest definitions
// Tree canopy greater than (%)
var ccThreshold = 10;
// Tree height greater than (meters)
var thThreshold = 5;
// minimum mapping unit
var mmu = 5;
step 4: Create a list with the years of interest
var years = ee.List.sequence(2000,2017,1)
step 5: create a forest cover timeseries
var forestCollection = ee.ImageCollection(years.map(function(year){

// set year of interest
var startDate = ee.Date.fromYMD(year,1,1);
var endDate = ee.Date.fromYMD(year,12,31);

// get image for the year
var thImage = ee.Image(th.filterDate(startDate,endDate).first());
var ccImage = ee.Image(cc.filterDate(startDate,endDate).first());

// Set the thresholds of the image
var treeheight = thImage.gt(thThreshold);
var canopy = ccImage.gt(ccThreshold);

// create the forest layer
var forest = treeheight.add(canopy).eq(2);
forest = forest.mask(forest);

// apply the minimum mapping unit
var map = forest.connectedPixelCount(mmu+2).gte(mmu);
return map.set("system:time_start",thImage.get("system:time_start"))
}))
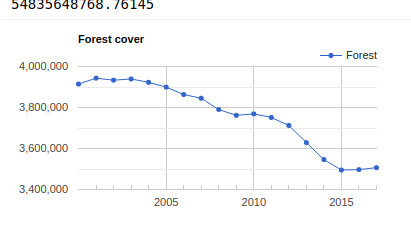
step 6: Plot the timeseries.
print(ui.Chart.image.series(forestCollection, chl, ee.Reducer.sum(), 100, 'system:time_start')
.setSeriesNames(['Forest'])
.setOptions({
title: 'Forest cover',
lineWidth: 1,
pointSize: 3,
}));
Assignment: calculate the total forested area as a percentage of the total.
Find the example here
