
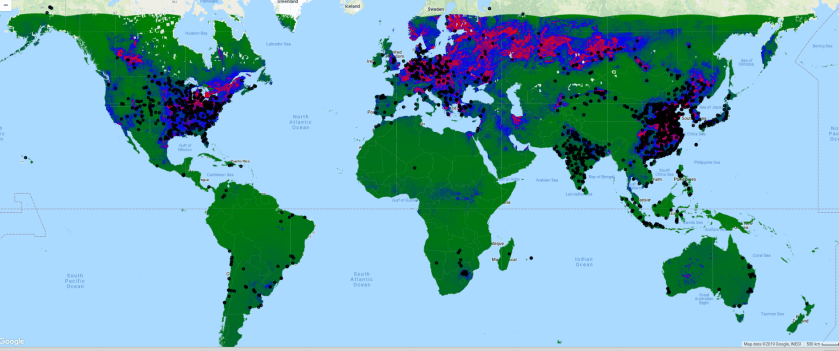
overlay with coal plants
Use the code below or click here.
var s5 = ee.ImageCollection("COPERNICUS/S5P/OFFL/L3_NO2").filterDate("2019-01-01","2019-01-31");
var powerplants = ee.FeatureCollection("WRI/GPPD/power_plants");
var coal = powerplants.filter(ee.Filter.eq("fuel1","Coal"));
var countries = ee.FeatureCollection("USDOS/LSIB_SIMPLE/2017")

Map.addLayer(s5.max().select("NO2_column_number_density").clip(countries),{min:0.00002,max:0.001,palette:"green,blue,red,purple"},"no2");
Map.addLayer(coal.draw("black"),{},"coal power plants")
