
Landsat 4, 9 and sentinel-2
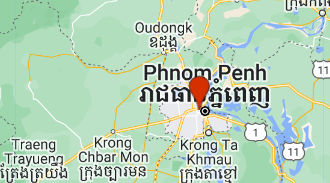
Step 1: add a marker to the map

Step 2: define the time period of interest
// set the start and end date
var startDate = ee.Date.fromYMD(2022,1,1);
var endDate = ee.Date.fromYMD(2022,9,30);
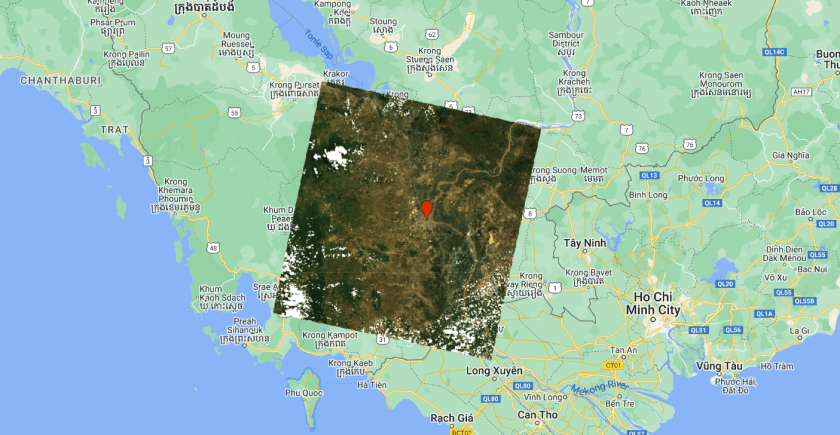
step 3: import sentinel-2 image collection
// import sentinel2 image collection
var s2 = ee.ImageCollection("COPERNICUS/S2_SR");
print(s2.filterDate(startDate,endDate).filterBounds(geometry));

// filter for time and aoi and sort according to cloud cover
s2 = s2.filterDate(startDate,endDate)
       .filterBounds(geometry)
       .sort("CLOUDY_PIXEL_OVER_LAND_PERCENTAGE");

// select the rgb channels of the first image
var image = ee.Image(s2.first()).select(["B4","B3","B2"],["red","green","blue"]);
// add the image to the map
Map.addLayer(image,{min:0,max:4000,bands:["red","green","blue"]},"sentinel 2 image");
step 4: hit run visualize the image
Step 5: add landsat 9 to the map as well using the code below
// import the landsat 9 image collection
var l9 = ee.ImageCollection("LANDSAT/LC09/C02/T1_L2");
print(l9.filterDate(startDate,endDate).filterBounds(geometry));

// filter for time and aoi and sort according to cloud cover
l9 = l9.filterDate(startDate,endDate)
       .filterBounds(geometry)
       .sort("CLOUD_COVER_LAND");

// select the rgb channels of the first image and multiply by scaling factors
var image = ee.Image(l9.first()).select(["SR_B4","SR_B3","SR_B2"],["red","green","blue"]).multiply(0.0000275).add(-0.2);
// add the image to the map
Map.addLayer(image,{min:0,max:0.30,bands:["red","green","blue"]},"landsat 9 image");
Step 6: landsat 4 is not available for current dates as it was decommissioned in 2012. We pick a historic image to visualize.
// set the start and end date
var startDate = ee.Date.fromYMD(1980,1,1);
var endDate = ee.Date.fromYMD(1990,1,1);

// import the landsat 4 image collection
var l4 = ee.ImageCollection("LANDSAT/LT04/C02/T1_L2");
print(l4.filterDate(startDate,endDate).filterBounds(geometry));

// filter for time and aoi and sort according to cloud cover
l4 = l4.filterDate(startDate,endDate)
       .filterBounds(geometry)
       .sort("CLOUD_COVER_LAND");

// select the rgb channels of the first image and multiply by scaling factors
var image = ee.Image(l4.first()).select(["SR_B3","SR_B2","SR_B1"],["red","green","blue"]).multiply(0.0000275).add(-0.2);
// add the image to the map
Map.addLayer(image,{min:0,max:0.30,bands:["red","green","blue"]},"landsat 4 image");
find the full code here
