
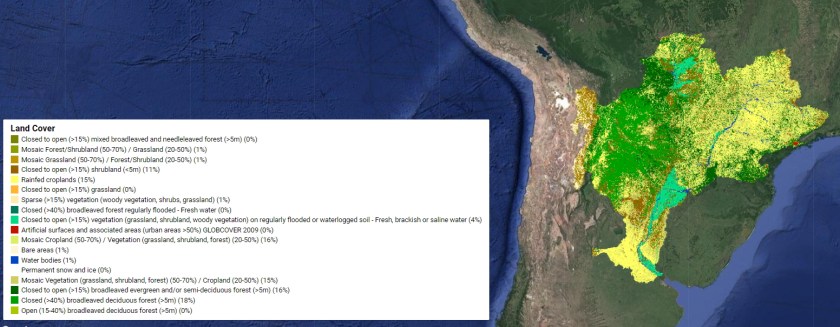
Globcover with legend and percentage of each class.
Use the code below or click this link.
// select the landcover band
var cover = globcover.select("landcover");

// add fusion table
var ft = ee.FeatureCollection("ft:1_posMR8h1zxkeyH6hYgWWq2mUNV4FtvqjPPJzhSZ");

// select polygon based on BASIN_ID
var myBasin = ft.filter(ee.Filter.eq("BASIN_ID",57719));

var frequency  =cover.reduceRegion({
  reducer:ee.Reducer.frequencyHistogram(),
  geometry:myBasin.geometry(),
  scale:1000
});

var dict = ee.Dictionary(frequency.get('landcover'));
var sum = ee.Array(dict.values()).reduce(ee.Reducer.sum(),[0]).get([0]);
var new_dict = dict.map(function(k,v) {
  return ee.Number(v).divide(sum).multiply(100).round();
});

// get
var d = new_dict.map(function(k, v) {
  var names = ee.List(cover.get('landcover_class_names'))
  var values = ee.List(cover.get('landcover_class_values'))
  return names.get(values.indexOf(ee.Number.parse(k))), v;
})

// get color
var c = new_dict.map(function(k, v) {
  var names = ee.List(cover.get('landcover_class_palette'))
  var values = ee.List(cover.get('landcover_class_values'))
  return ee.String(names.get(values.indexOf(ee.Number.parse(k))));
})

var namez = new_dict.map(function(k, v) {
  var names = ee.List(globcover.get('landcover_class_names'))
  var values = ee.List(globcover.get('landcover_class_values'))
  return [names.get(values.indexOf(ee.Number.parse(k)))];
}).values().flatten()

/************************ legend ****************************/

// set position of panel
var legend = ui.Panel({
  style: {
    position: 'bottom-left',
    padding: '8px 15px'
  }
});

// Create legend title
var legendTitle = ui.Label({
  value: 'Land Cover',
  style: {
    fontWeight: 'bold',
    fontSize: '18px',
    margin: '0 0 4px 0',
    padding: '0'
    }
});

// Add the title to the panel
legend.add(legendTitle);

// Creates and styles 1 row of the legend.
var makeRow = function(color, name) {

      // Create the label that is actually the colored box.
      var colorBox = ui.Label({
        style: {
          backgroundColor: '#' + color,
          // Use padding to give the box height and width.
          padding: '8px',
          margin: '0 0 4px 0'
        }
      });

      // Create the label filled with the description text.
      var description = ui.Label({
        value: name,
        style: {margin: '0 0 4px 6px'}
      });

      // return the panel
      return ui.Panel({
        widgets: [colorBox, description],
        layout: ui.Panel.Layout.Flow('horizontal')
      });
};

//  Palette with the colors
var palette = ee.List(c.values());

// name of the legend
var names = ee.List(d.values());

// Add color and and names
for (var i = 0; i < 18; i++) {
   var myPercentage = ee.Number(names.get(i).getInfo());
   var myName = ee.String(namez.get(i).getInfo());
   var txt = myName.cat(" (").cat(myPercentage.toInt()).cat("%)");
   legend.add(makeRow(palette.get(i).getInfo(),txt.getInfo() ));
  }

Map.addLayer(cover.clip(myBasin));

// add legend to map (alternatively you can also print the legend to the console)
Map.add(legend);
