
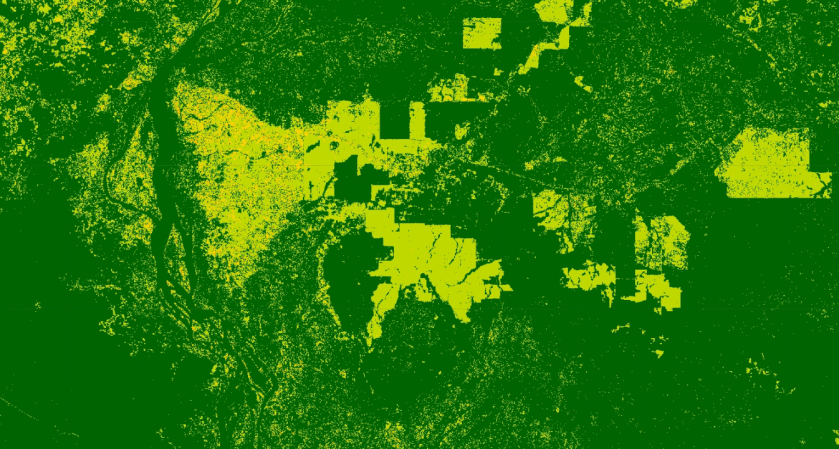
Count the number of disturbances
Use the code below or click here
// Load Study Area
var mekongBuffer = ee.FeatureCollection('ft:1LEGeqwlBCAlN61ie5ol24NdUDqB1MgpFR_sJNWQJ');
var mekongRegion = mekongBuffer.geometry(); // Buffered region

// import tree canopy cover and tree canopy height
var tccCollection = ee.ImageCollection("projects/servir-mekong/UMD/tree_canopy");

// set the thresholds
var thtcc = 10;

var years = ee.List.sequence(1989,2013,1)

var rotation = ee.ImageCollection(years.map(function(y){

var startDate = ee.Date.fromYMD(y, 1, 1).advance(-1,"year")
var endDate = ee.Date.fromYMD(y, 12, 31).advance(-1,"year")
var past = ee.Image(tccCollection.filterDate(startDate,endDate).first())

var startDate = ee.Date.fromYMD(y, 1, 1)
var endDate = ee.Date.fromYMD(y, 12, 31)
var now = ee.Image(tccCollection.filterDate(startDate,endDate).first())

past = past.gte(thtcc)
now = now.eq(0)

var disturbance = past.and(now)
return disturbance.set("system:time_start",startDate);
}))

var myImg = ee.Image(rotation.sum())

// display the image
Map.addLayer(myImg.clip(mekongRegion),{min:0,max:4,palette:"darkgreen,yellow,orange,red"})
