

Discover the areas under biophysical stress
The biophysical environment is the biotic and abiotic surrounding of an organism or population, and consequently includes the factors that have an influence in their survival, development and evolution.
Human environmental impacts may affects the biophysical environments, biodiversity and other resources. As such, it is important to monitor the biophysical health of an area.
Remote sensing can be used to assess the biophysical status of an area in a fast and cost-effective manner, whereas field assessments are often time and resource consuming.
Step 1: copy the template into a new script and fill in the author details, date and contact information.
Step 2: import the MODIS/MYD13A1 image collection and select the EVI.
Step 3: Create a reference dataset by filtering for the dates from 2000 – 2010.
// calculate reference
var reference = collection.filterDate('2001-01-01', '2010-12-31').sort('system:time_start', false);
// calculate the series
var series = EVI.filterDate('2001-01-01', '2010-12-31').sort('system:time_start', false).select("EVI");
Step 4: Show the mean using the code below. Chose appropriate values for min and max.
Map.addLayer(reference.mean(),
    {min: ??, max: ??, palette: ["fdff42","4bff0f","0fa713"]}, 'EVI mean');
Tip! Use the inspector the check the range of values.
Step 5: Create an new image collection for the period 2011 – 2016. Give this image collection the name “series”.
Step 6: Create an new image collection for the period 2011 – 2016. Give this image collection the name “series”.
var subtractmean = function(image) {
    return image.subtract(mean).set('system:time_start', image.get('system:time_start'));
};

// run all images in the image collection series in the substractmean function
var mapseries = series.map(subtractmean);
Step 7: Use the snippet below to show the anomaly map
Map.addLayer(mapseries.mean(),
    {min: ??, max: ??, palette: ["931206","ff1b05","fdff42","4bff0f","0fa713"]}, 'EVI anomoly')
Step 8: Get the timestamp from the most recent image in the reference collection.
// Get the timestamp from the most recent image in the reference collection.
var time0 = reference.first().get('system:time_start');
Step 9: Create a list that starts with value 0
var first = ee.List([ee.Image(0).set('system:time_start', time0).select([0], ['EVI'])]);
step 10: include the code below
// This is a function to pass to Iterate().
// As anomaly images are computed, add them to the list.
var accumulate = function(image, list) {
        // Get the latest cumulative anomaly image from the end of the list with
        // get(-1).  Since the type of the list argument to the function is unknown,
        var previous = ee.Image(ee.List(list).get(-1));
        // Add the current anomaly to make a new cumulative anomaly image.
       var added = image.add(previous).set('system:time_start', image.get('system:time_start'));
        // Return the list with the cumulative anomaly inserted.
        return ee.List(list).add(added);
};

// Create an ImageCollection of cumulative anomaly images by iterating.
var cumulative = ee.ImageCollection(ee.List(mapseries.iterate(accumulate, first)));
Step 11: Add a geometry to the data section of the scripting
var geometry = ee.Geometry.Rectangle([105.0, 20.30, 106.5, 22.0]);
Step 12: Display the polygon
Step 13: Copy the text below to the ‘User specified parameters’ section of the script.
// Predefine the chart titles.
var title = {
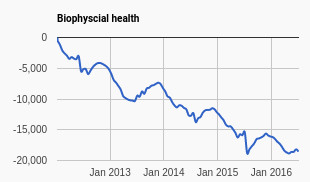
title: 'Cumulative EVI anomaly over time',
hAxis: {title: 'Time'},
vAxis: {title: 'Cumulative EVI anomaly'},
};
Step 14: Print the chart of the cumulative maps using the code below
print(Chart.image.seriesByRegion(cumulative, geometry, ee.Reducer.mean(), 'EVI', 500, 'system:time_start', 'PROJECT').setOptions(title));
Step 15: Add the map to the screen:
Map.addLayer(mapseries.mean(),
    {min: -500, max: 500, palette: ["931206","ff1b05","fdff42","4bff0f","0fa713"]}, 'EVI anomoly');
Find an example here
