
analyse worldPop timeseries
Step 1: add the relevant data
// define the countries of interest in this list
var countryList = ["Cambodia","Vietnam","Laos","Burma","Thailand"];
// import the country boundaries and filter for the countries of interest
var countries = ee.FeatureCollection('USDOS/LSIB_SIMPLE/2017').filter(ee.Filter.inList("country_na", countryList));

// import worldpop data
var wp = ee.ImageCollection("WorldPop/GP/100m/pop").filterBounds(countries);


// set the start and end dates
var start = ee.Date.fromYMD(2020,1,1);
var end = ee.Date.fromYMD(2020,12,31);

// filter for the period of interest
var wp2020 = ee.Image(wp.filterDate(start,end).mean());
// clip for the area of interest
wp2020 = wp2020.clip(countries);
s
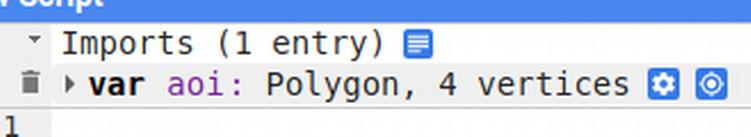
Step 2: draw an area of interest

Step 3: rename geometry to aoi
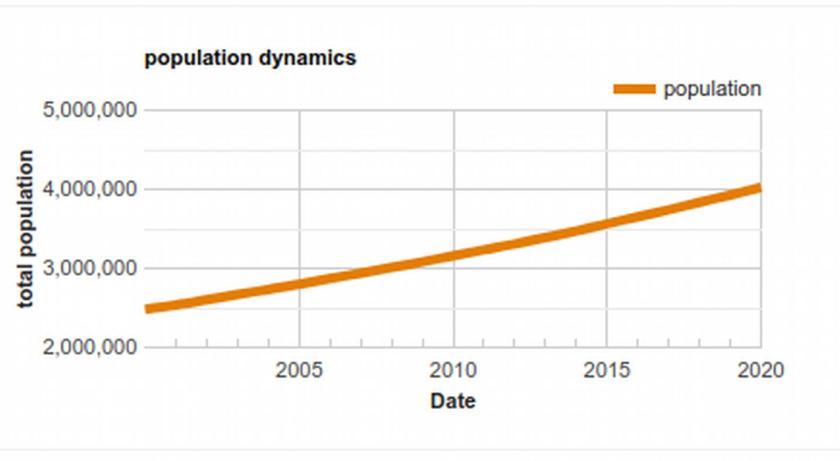
step 4: calculate the total population per year
// Define the chart and print it to the console.
var chart =
    ui.Chart.image.seriesByRegion
        ({
          imageCollection:wp,
          regions: aoi,
          reducer: ee.Reducer.sum(),
          scale: 100,
          xProperty: 'system:time_start'
        })
        .setSeriesNames(['population'])
        .setOptions({
          title: 'population dynamics',
          hAxis: {title: 'Date', titleTextStyle: {italic: false, bold: true}},
          vAxis: {
            title: 'total population',
            titleTextStyle: {italic: false, bold: true}
          },
          lineWidth: 5,
          colors: ['e37d05'],
          curveType: 'function'
        });

print(chart);
use this link for the full version.

hi? is this data use geometry(aoi) or conutry boundry ıa couldn’n undestand it.At the chart region is chooosen geometry chart is workin due to geometry .So where does counrty boundry is used?thank you very much
LikeLike